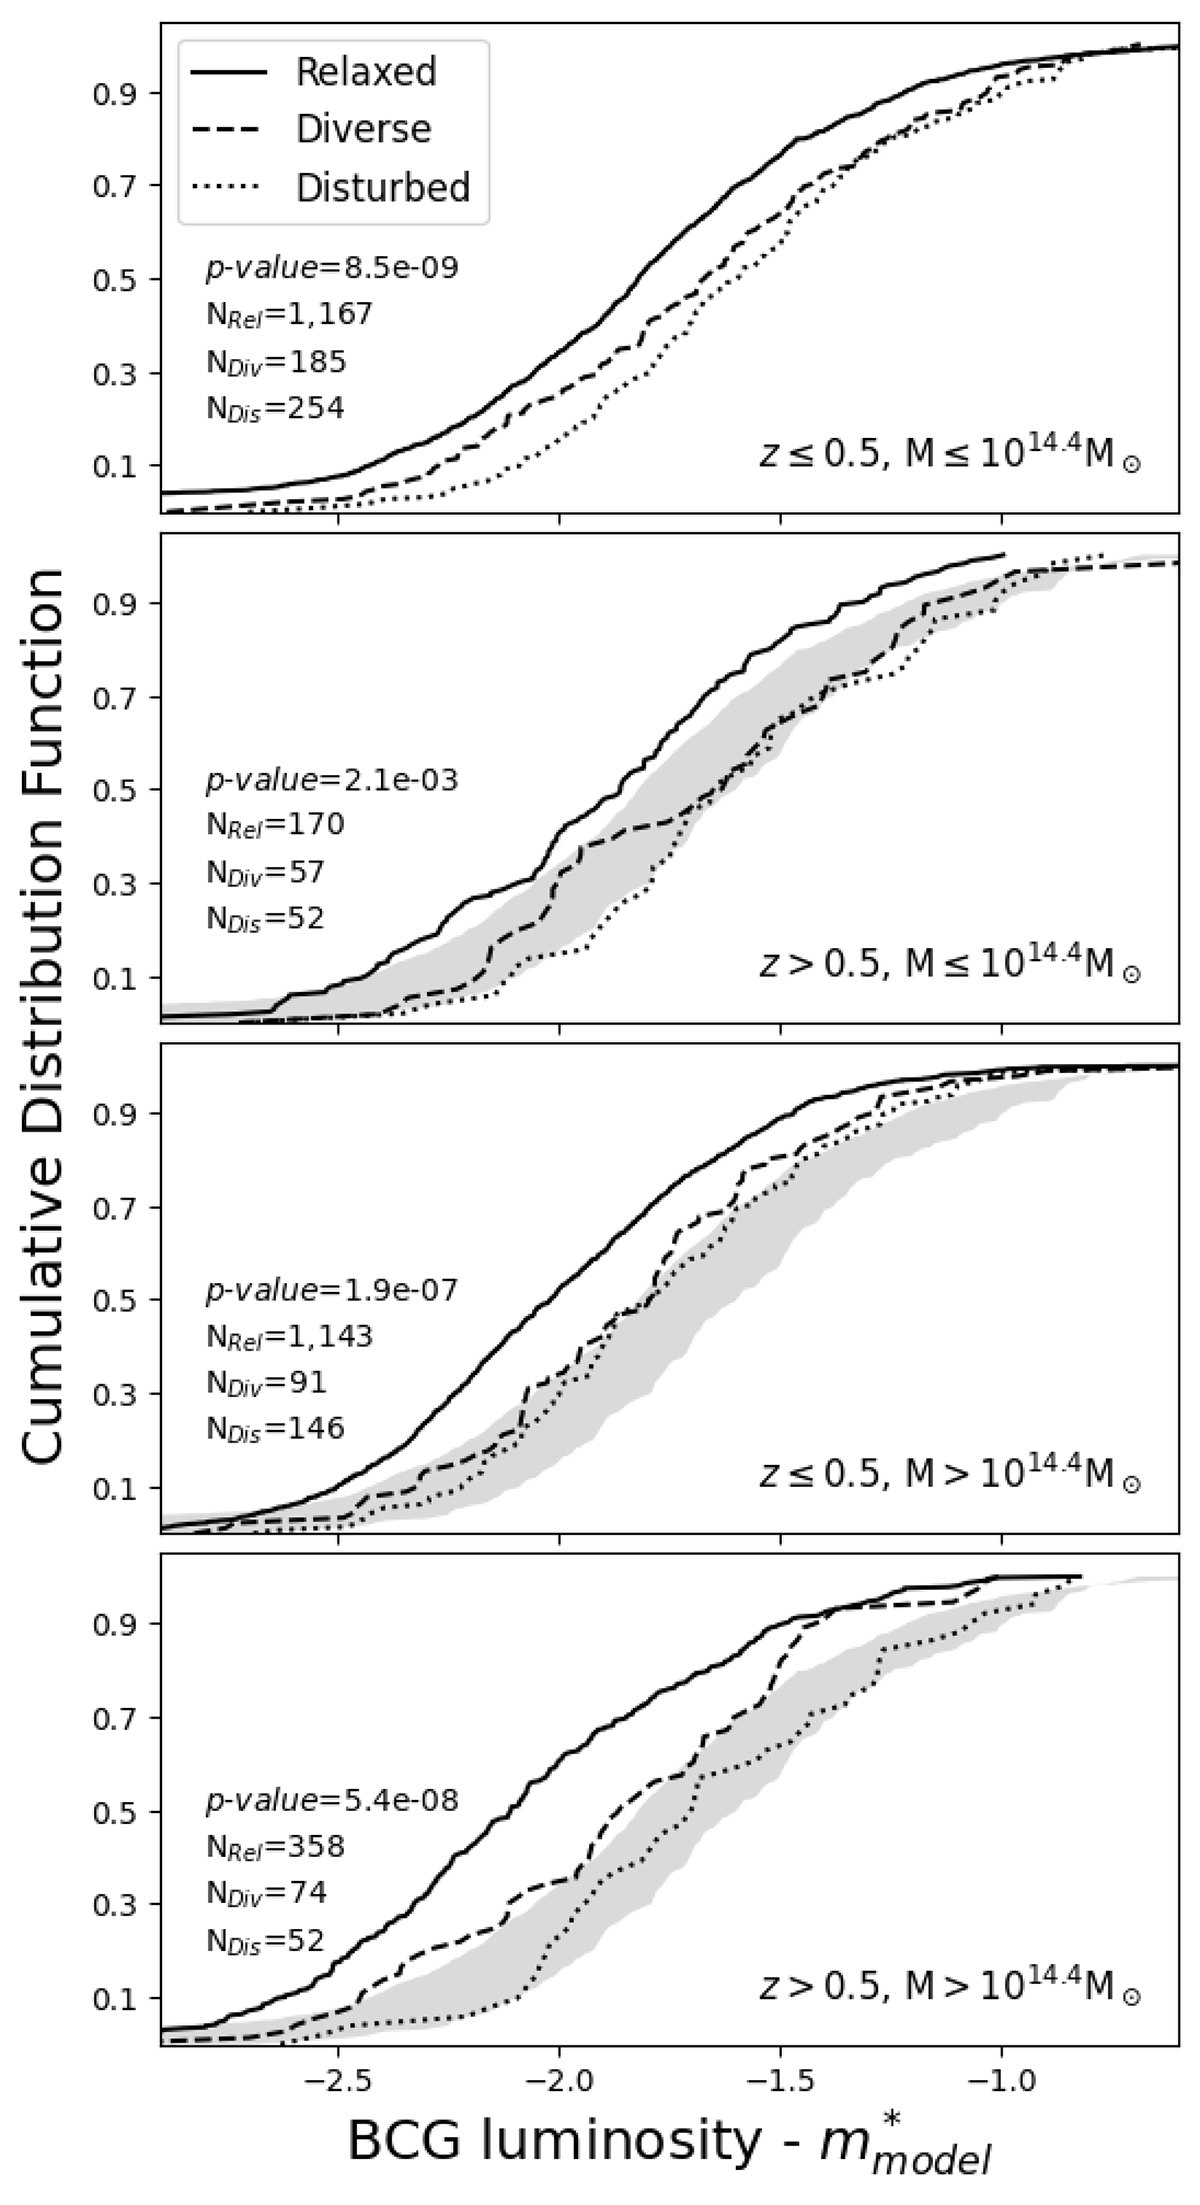
Fig. 6.
Download original image
Example of a cumulative distribution of the BCG luminosity. We used the BCG r band for z < 0.35, the i band for z < 0.7, and the z band for z > 0.7. The lines correspond to relaxed clusters (solid; DBCG − X < 0.25R500), disturbed clusters (dotted; DBCG − X > 0.5R500), and the remaining cluster sample (dashed; 0.25R500 < DBCG − X < 0.5R500). In the bottom-left corner of each panel, the number of clusters used and the KS p-value comparing the relaxed and disturbed samples are displayed. Top panel: BCGs at z ≤ 0.5 and cluster mass ≤1014.4 M⊙. Middle-top panel: BCGs at z > 0.5 and cluster mass ≤1014.4 M⊙. Middle-bottom panel: BCGs at z ≤ 0.5 and cluster mass > 1014.4 M⊙. Bottom panel: BCGs at z > 0.5 and cluster mass > 1014.4 M⊙. The shaded area corresponds to the area covered by the BCG distributions in the top panel. BCGs from the relaxed cluster sample tend to be brighter than BCGs in both the disturbed and the general population samples, most significantly at higher redshifts.
Current usage metrics show cumulative count of Article Views (full-text article views including HTML views, PDF and ePub downloads, according to the available data) and Abstracts Views on Vision4Press platform.
Data correspond to usage on the plateform after 2015. The current usage metrics is available 48-96 hours after online publication and is updated daily on week days.
Initial download of the metrics may take a while.