Fig. 5.
Download original image
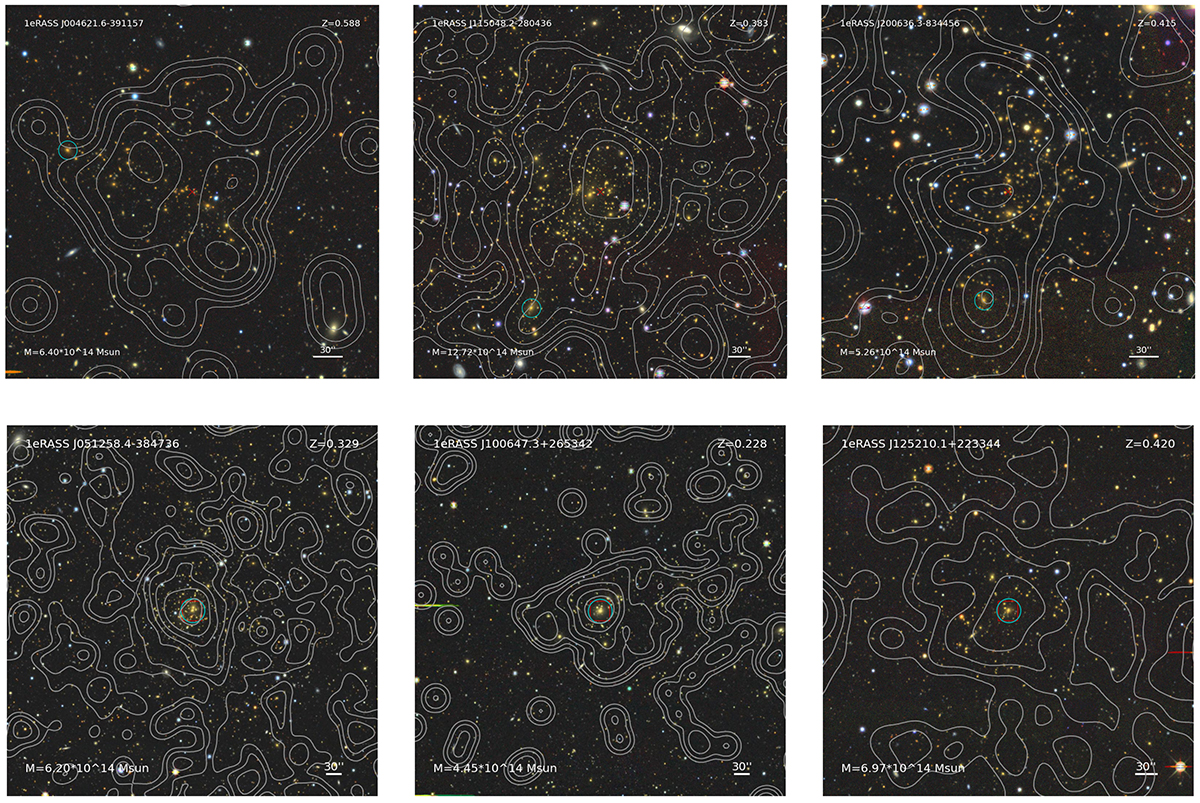
Top: Example of three unrelaxed clusters as seen in LS composite red-green-blue images. Bottom: Example of three relaxed clusters as seen in LS composite red-green-blue images. Each image is centred at the peak of X-ray emission, shown by the red cross. White contours correspond to eROSITA X-ray contours. The cyan marker encircles the respective BCG of the cluster. The cluster redshift and cluster mass are indicated in the upper-right and lower-left corners of each panel, respectively, while the white bar shows the angular scale on the sky. North is up and east is to the left in all the images. The size of each image is 2.25R500 per side.
Current usage metrics show cumulative count of Article Views (full-text article views including HTML views, PDF and ePub downloads, according to the available data) and Abstracts Views on Vision4Press platform.
Data correspond to usage on the plateform after 2015. The current usage metrics is available 48-96 hours after online publication and is updated daily on week days.
Initial download of the metrics may take a while.