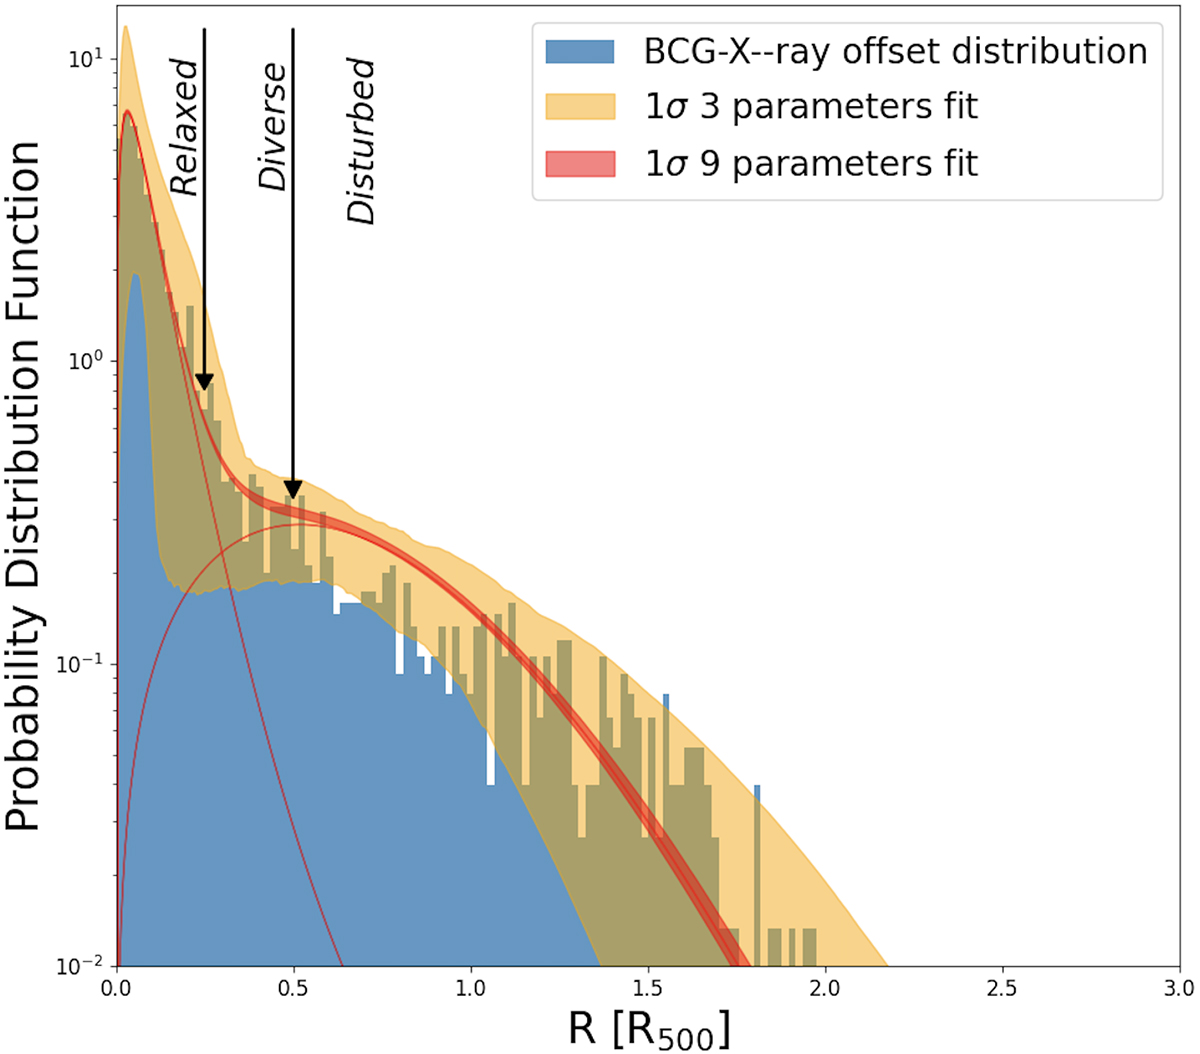
Fig. 4.
Download original image
Observed X-ray/optical miscentring distribution (blue) for the analysed total cluster sample. The plot shows the results obtained using Eq. (2). The yellow and red regions show the marginalized distribution for the 35 analysed bins without and with evolutionary terms, respectively (Eq. (3)). The red curves are the best fits for the relaxed and disturbed distribution components.
Current usage metrics show cumulative count of Article Views (full-text article views including HTML views, PDF and ePub downloads, according to the available data) and Abstracts Views on Vision4Press platform.
Data correspond to usage on the plateform after 2015. The current usage metrics is available 48-96 hours after online publication and is updated daily on week days.
Initial download of the metrics may take a while.