Fig. 3.
Download original image
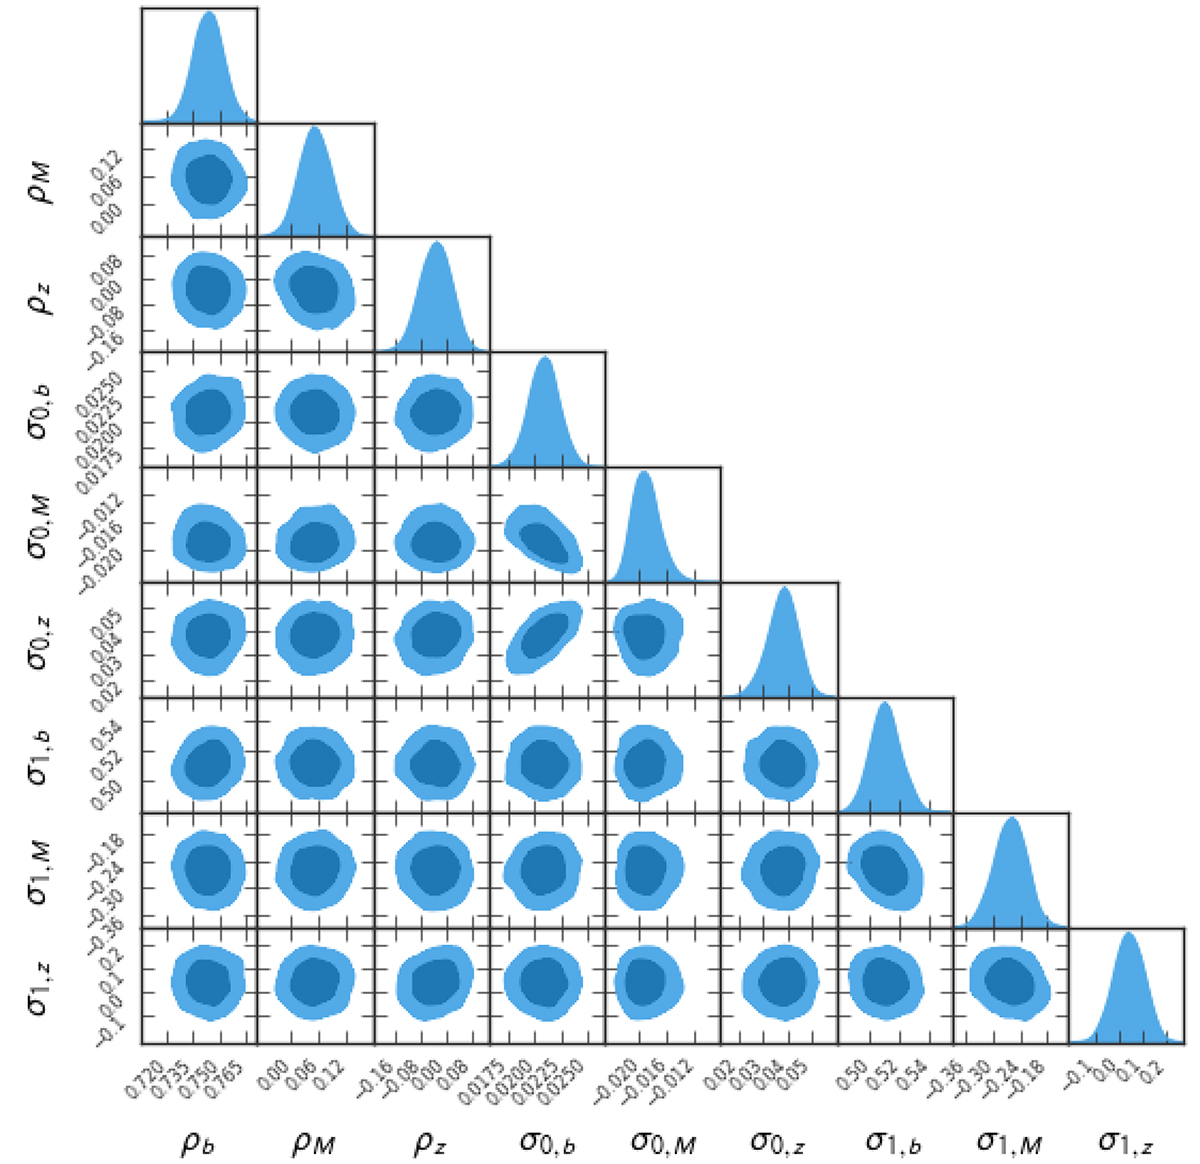
Marginalized distribution of the miscentring model described by Eqs. (2) and (3). σ0 has a positive correlation with redshift (![]() ) and a negative correlation with mass (
) and a negative correlation with mass (![]() ). σ1 has a negative correlation with mass (σ1, M=
). σ1 has a negative correlation with mass (σ1, M= ![]() ). If we use the optical centre instead of the BCG to measure the offset distribution, the σ1 positive redshift correlation (
). If we use the optical centre instead of the BCG to measure the offset distribution, the σ1 positive redshift correlation (![]() ) and σ0 negative mass correlation (σ1, M=
) and σ0 negative mass correlation (σ1, M= ![]() ) stands, though both are much weaker.
) stands, though both are much weaker.
Current usage metrics show cumulative count of Article Views (full-text article views including HTML views, PDF and ePub downloads, according to the available data) and Abstracts Views on Vision4Press platform.
Data correspond to usage on the plateform after 2015. The current usage metrics is available 48-96 hours after online publication and is updated daily on week days.
Initial download of the metrics may take a while.