Fig. A.4
Download original image
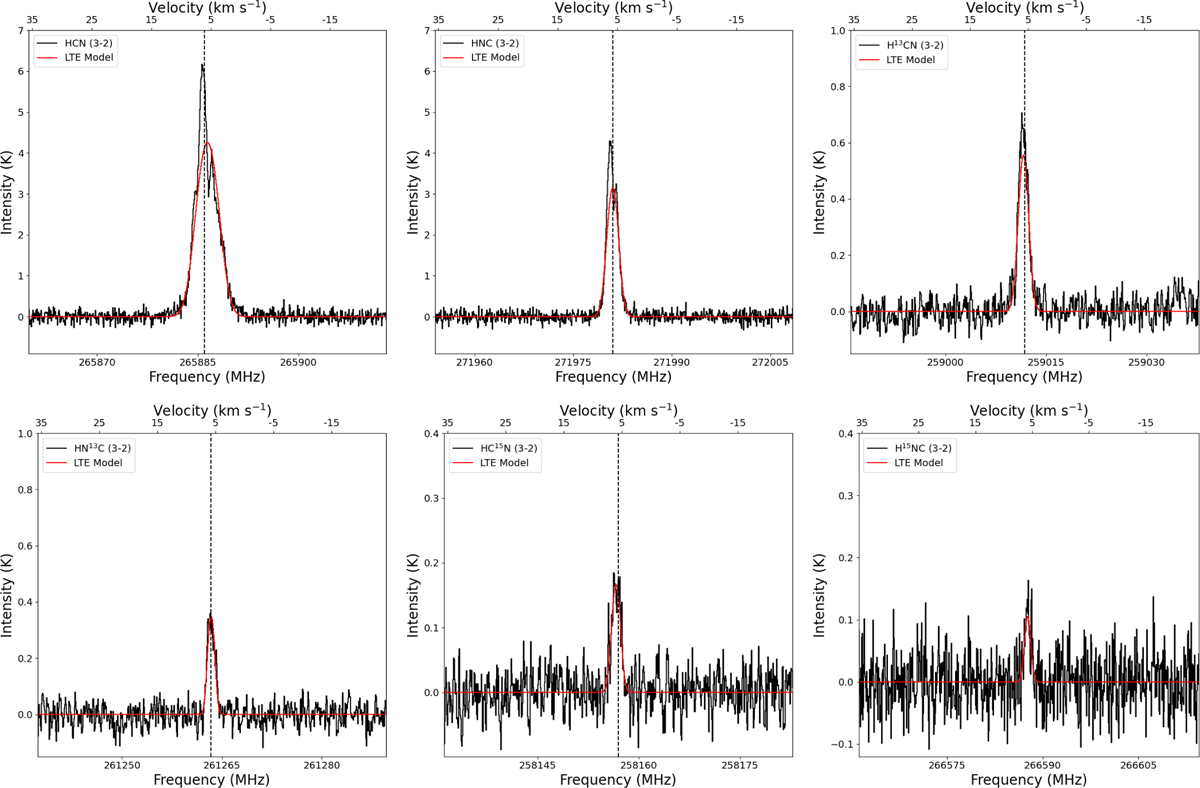
APEX-detected spectral lines of HCN and HNC isotopologues towards R CrA IRS 7B (black histogram), with corresponding LTEMCMC models shown as solid red lines. The HCN and HNC J = 3–2 transitions, exhibiting excitation temperatures (Texc) of 26(5) K and 27(5) K, respectively, and a column density ratio N(HNC)/N(HCN) ≈ 0.30. The H13CN and HN13C J = 3–2 transitions, with Texc of 11(3) K and 12(2) K, respectively, and N(HN13C)/N(H13CN) ≈ 0.38. The HC15N and H15NC J = 3–2 transitions, with Texc of 11(4) K and 14(2) K, respectively, and N(HN15C)/N(HC15N) ≈ 0.39.
Current usage metrics show cumulative count of Article Views (full-text article views including HTML views, PDF and ePub downloads, according to the available data) and Abstracts Views on Vision4Press platform.
Data correspond to usage on the plateform after 2015. The current usage metrics is available 48-96 hours after online publication and is updated daily on week days.
Initial download of the metrics may take a while.