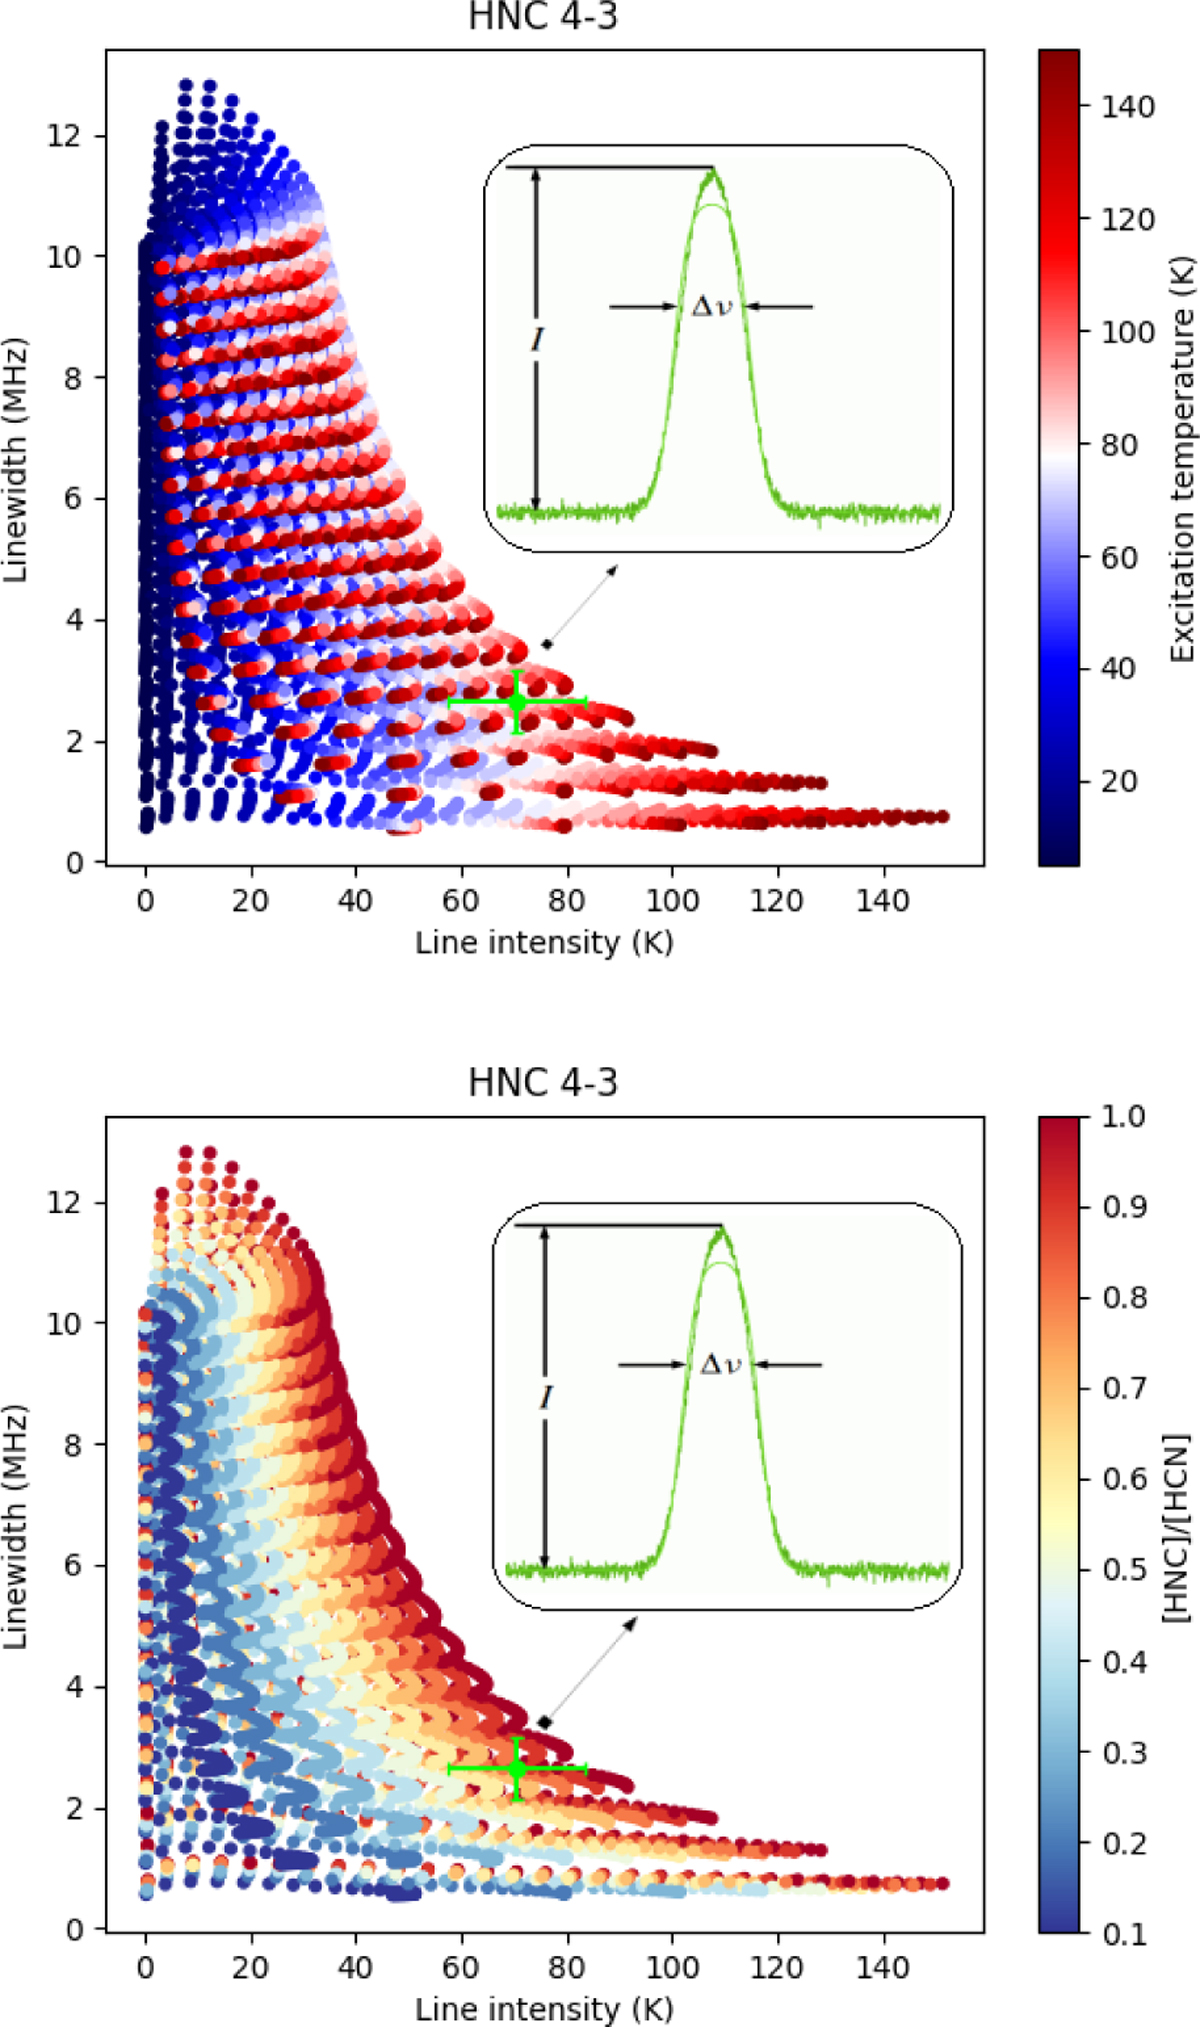
Fig. A.3
Download original image
Data distribution of the profiles of the simulated spectral line J = 4–3 of HNC for the grid of physical parameters values. The top display shows the temperature mapping of the data while the bottom one shows the abundance ratio mapping. Both panels depict the HNC J = 4–3 line transition, from which the line intensity and linewidth, along with their associated error bars, are obtained for the semi-empirical data of Orion KL. These values are indicated by a green dot in each panel.
Current usage metrics show cumulative count of Article Views (full-text article views including HTML views, PDF and ePub downloads, according to the available data) and Abstracts Views on Vision4Press platform.
Data correspond to usage on the plateform after 2015. The current usage metrics is available 48-96 hours after online publication and is updated daily on week days.
Initial download of the metrics may take a while.