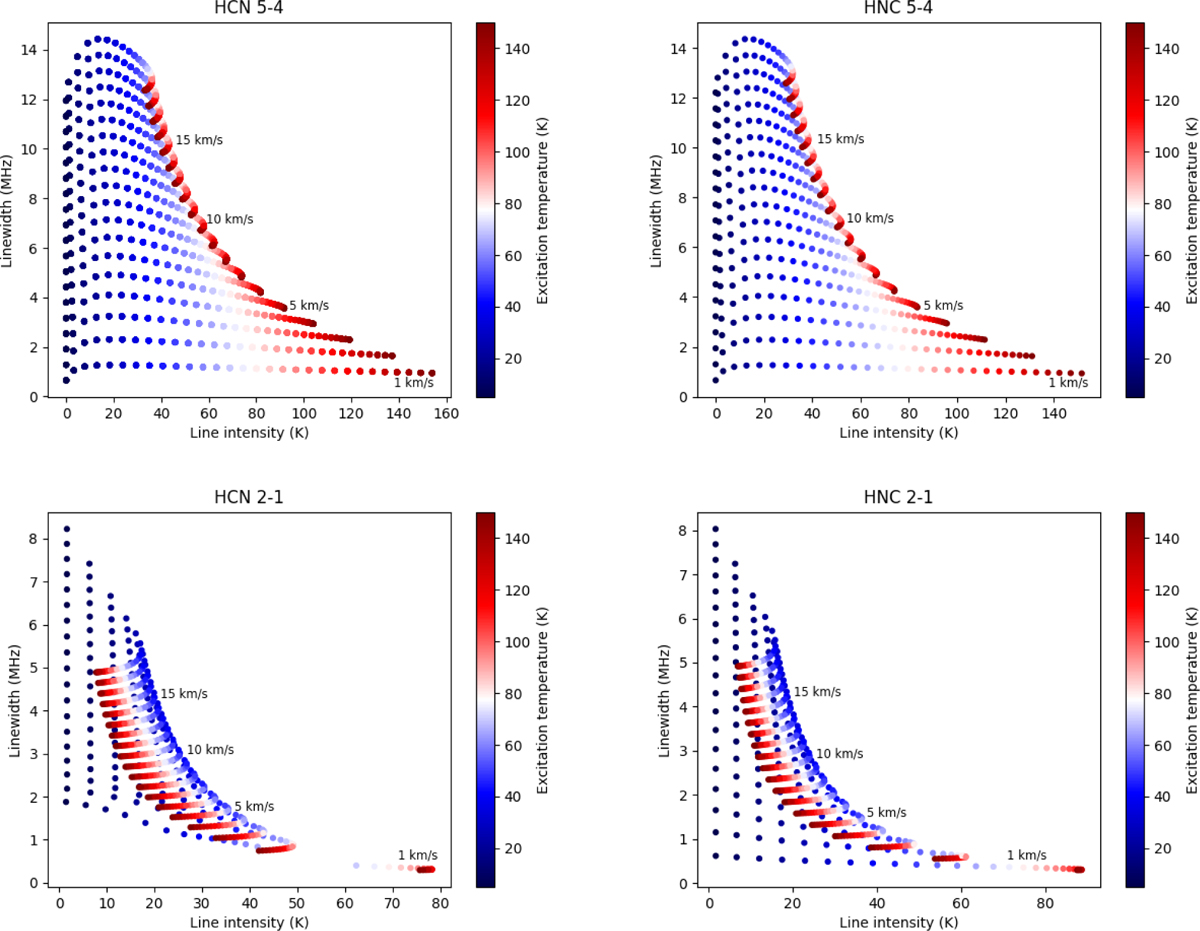
Fig. A.1
Download original image
Data distributions of the profiles of the spectral lines J = 5–4 and J = 2–1 of HCN and HNC parametrised with the variables (I, Δv). The upper and lower rows show the data distributions of J = 5–4 and J = 2–1, respectively, for HCN (left panels) and HNC (right panels). The HNC/HCN ratio and the source’s size are fixed to 0.8 and 5 arcsec, respectively. As the data are distributed by branches of points, corresponding to the steps of ΔVsys, only those with ΔVsys = 1, 5, 10 and 15 km/s are showcased for the sake of clarity.
Current usage metrics show cumulative count of Article Views (full-text article views including HTML views, PDF and ePub downloads, according to the available data) and Abstracts Views on Vision4Press platform.
Data correspond to usage on the plateform after 2015. The current usage metrics is available 48-96 hours after online publication and is updated daily on week days.
Initial download of the metrics may take a while.