Open Access
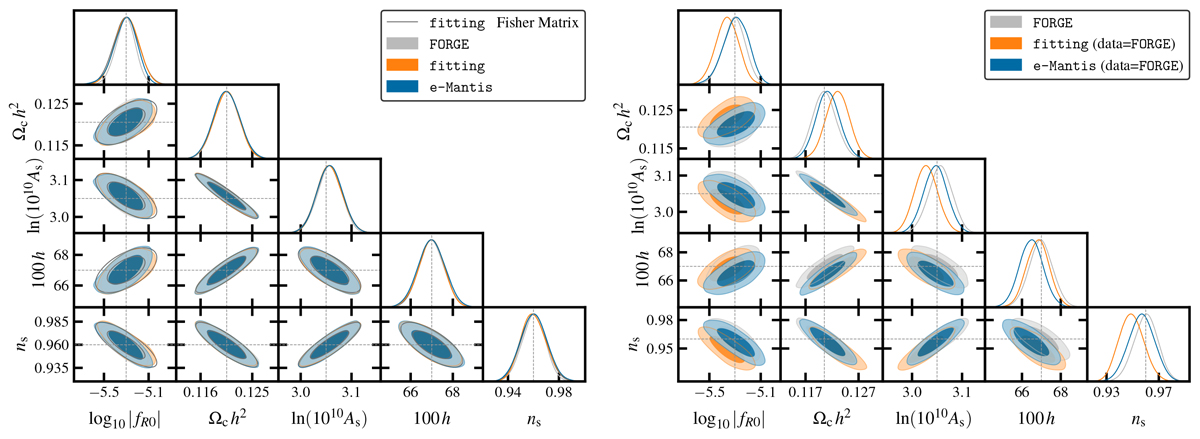
Fig. 5.
Download original image
Constraints from 3 × 2 pt analysis in the pessimistic setting. In the left panel, the same nonlinear model is used for the data and the fitting while in the right panel, the data are generated by FORGE.
Current usage metrics show cumulative count of Article Views (full-text article views including HTML views, PDF and ePub downloads, according to the available data) and Abstracts Views on Vision4Press platform.
Data correspond to usage on the plateform after 2015. The current usage metrics is available 48-96 hours after online publication and is updated daily on week days.
Initial download of the metrics may take a while.