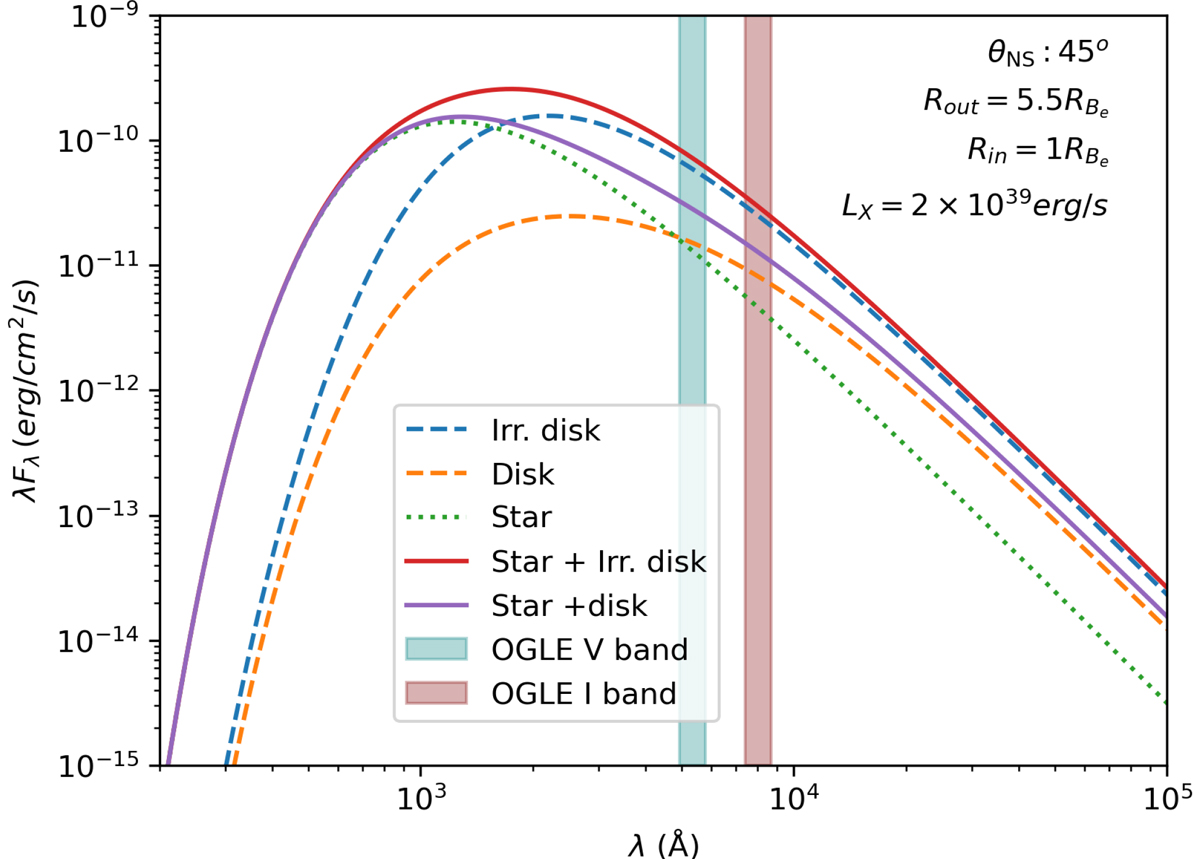
Fig. 3.
Download original image
Computed SED for a particular system configuration, similar to the ones presented in Fig. 2. Note the lower value of Rout for the Be disk to encapsulate a truncated outer disk. We plot the total SED and individual components of the star, the non-irradiated disk, and the irradiated disk. Vertical stripes mark the range of the OGLE filters.
Current usage metrics show cumulative count of Article Views (full-text article views including HTML views, PDF and ePub downloads, according to the available data) and Abstracts Views on Vision4Press platform.
Data correspond to usage on the plateform after 2015. The current usage metrics is available 48-96 hours after online publication and is updated daily on week days.
Initial download of the metrics may take a while.