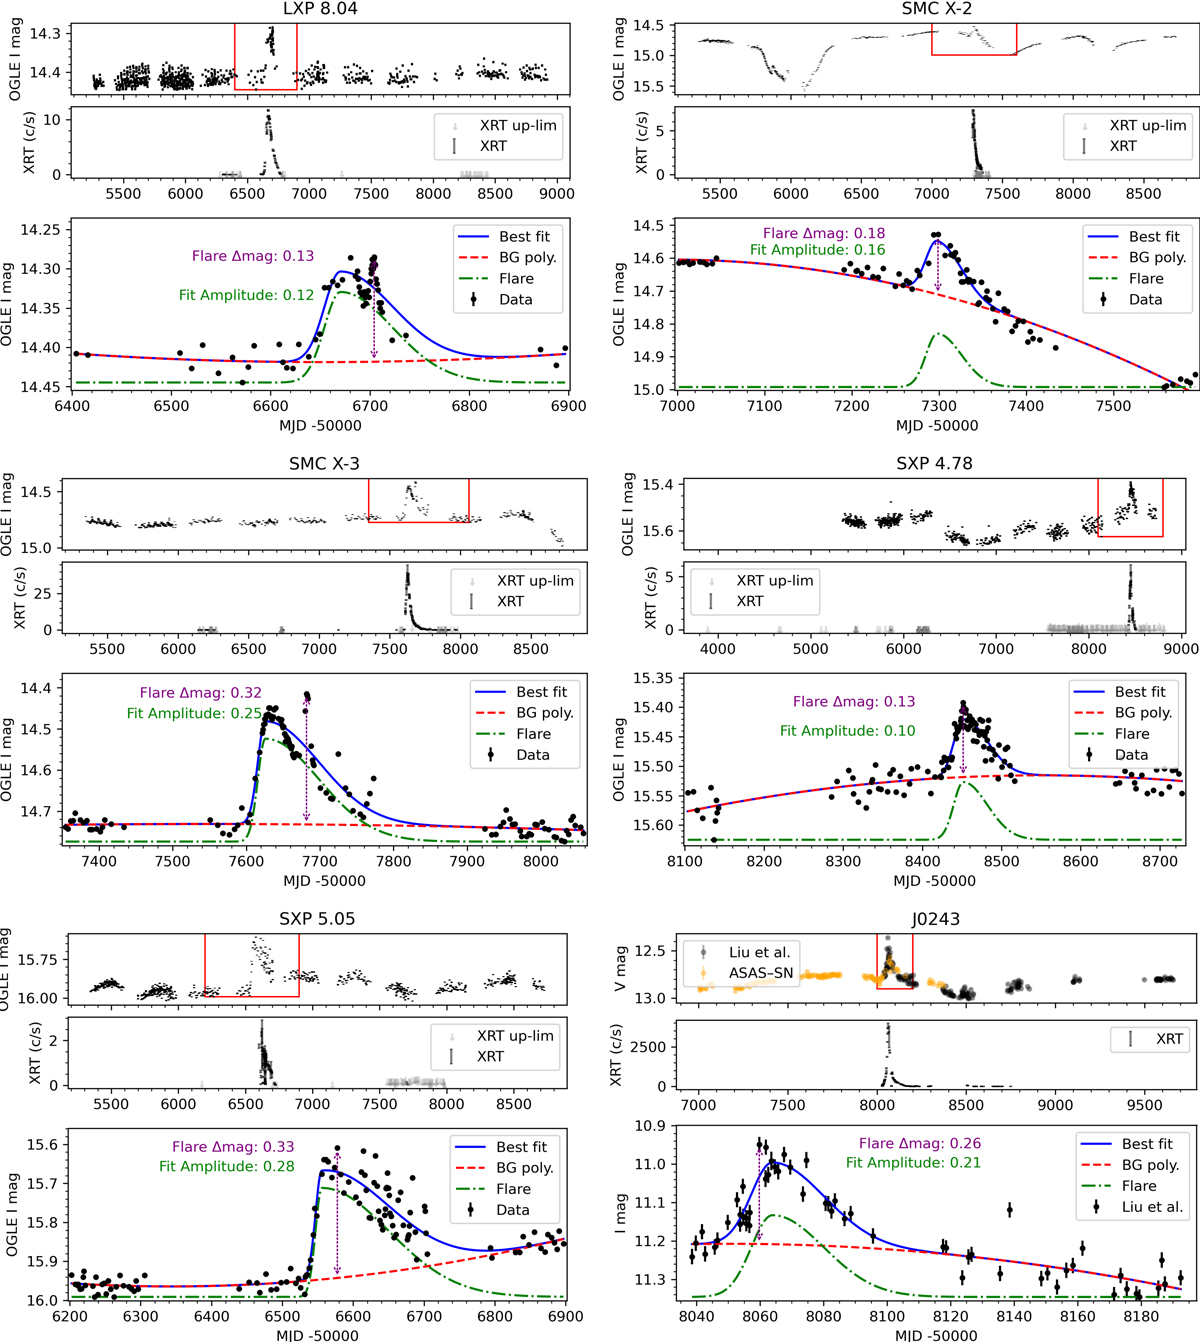
Fig. 1.
Download original image
Optical flares during major outbursts from BeXRBs. The top panels show the historic OGLE I band light curves, while the epochs of flares are marked with red boxes. The middle panels present Swift/XRT 0.3–10.0 keV light curves. Each flare (see lower panel) is fit by a model composed of a polynomial and a two-sided Gaussian. The flare amplitude from the fit is given in the label with green fonts. We also mark the I mag of the maximum flux with a vertical magenta arrow and provide the Δmag difference of that point from the polynomial background. The difference between the two maxima could be related to orbital modulation during the flares (see the cases of SXP 5.05 and LXP 8.04).
Current usage metrics show cumulative count of Article Views (full-text article views including HTML views, PDF and ePub downloads, according to the available data) and Abstracts Views on Vision4Press platform.
Data correspond to usage on the plateform after 2015. The current usage metrics is available 48-96 hours after online publication and is updated daily on week days.
Initial download of the metrics may take a while.