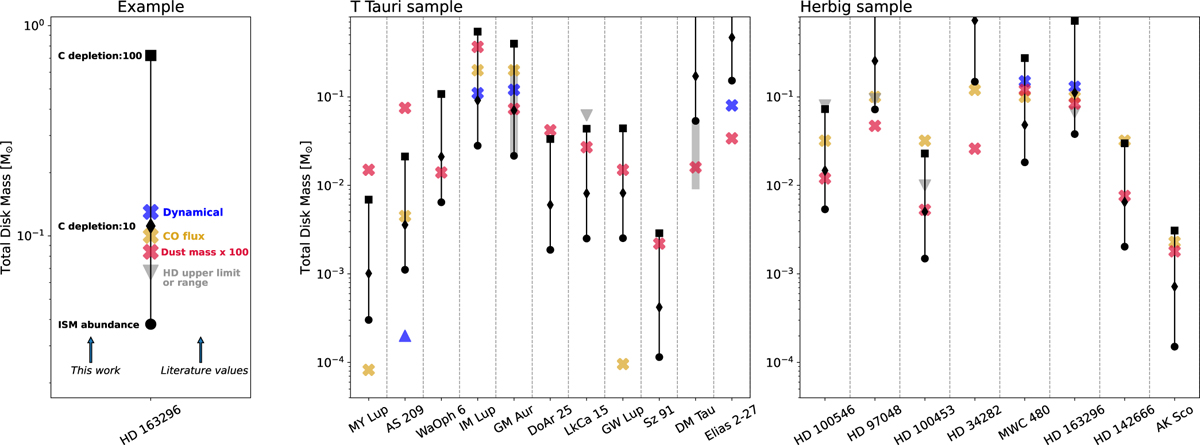
Fig. 7
Download original image
Estimated total disk masses from z/r analysis, using varying carbon abundances, compared to literature values. Leftmost panel is an example and legend showing the Herbig system HD 163296. Black symbols correspond to the estimates done in this work from the characteristic z/r, where circles, diamonds, and squares have been calculated using the z/r–Md relationship curves for ISM-like 10 and 100 values of volatile carbon depletion, respectively. For each disk, the available literature values of the total disk mass are shown in colored crosses, depending on the methodology used for their calculation and grey triangles and shaded areas for the HD upper limits and mass range values, respectively. The center and rightmost panels show the results for the full T Tauri and Herbig samples.
Current usage metrics show cumulative count of Article Views (full-text article views including HTML views, PDF and ePub downloads, according to the available data) and Abstracts Views on Vision4Press platform.
Data correspond to usage on the plateform after 2015. The current usage metrics is available 48-96 hours after online publication and is updated daily on week days.
Initial download of the metrics may take a while.