Fig. 6
Download original image
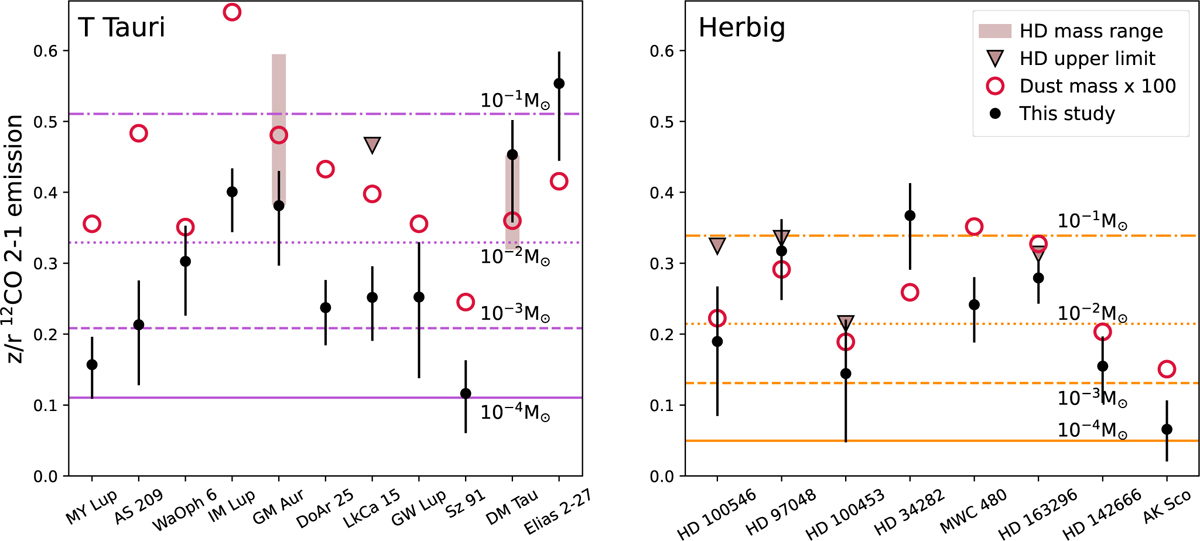
Comparison between the measured 12CO surface z/r for a sample of disks and their expected values, based on literature total disk mass estimates from dust continuum observations. Black dots indicate the z/r values obtained in this study for our disk sample, open red circles trace the expected z/r values estimated from the dust continuum total disk masses and downwards triangles or shaded areas the expected upper limits or range values of z/r from HD measurements, respectively. The left panel shows the results for a T Tauri system and right panel for a Herbig system. Each horizontal line indicates the z/r of our DALI models with disk masses of 10−4 M⊙, 10−3 M⊙, 10−2 M⊙, and 10−1 M⊙, in increasing z/r order, respectively.
Current usage metrics show cumulative count of Article Views (full-text article views including HTML views, PDF and ePub downloads, according to the available data) and Abstracts Views on Vision4Press platform.
Data correspond to usage on the plateform after 2015. The current usage metrics is available 48-96 hours after online publication and is updated daily on week days.
Initial download of the metrics may take a while.