Fig. 3
Download original image
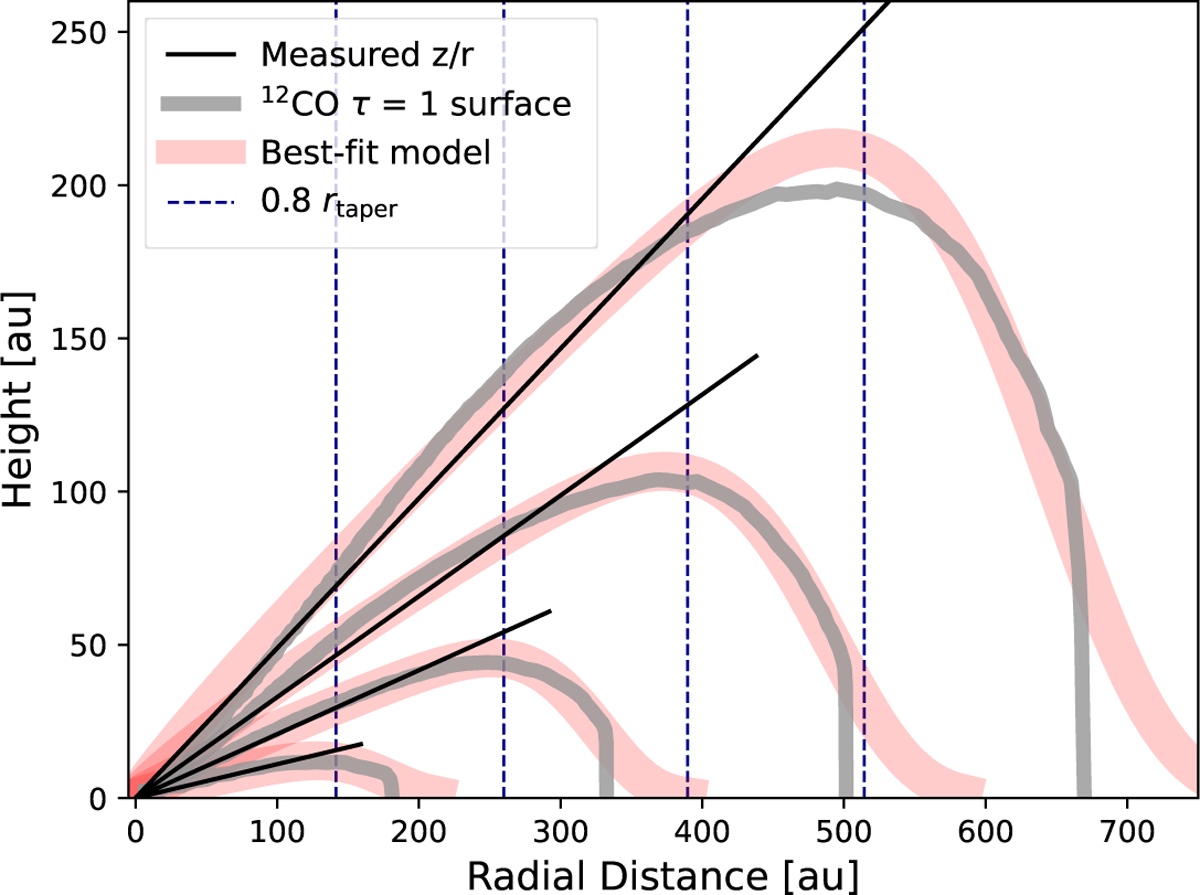
Schematic of the method used to measure the 12CO surface z/r values. Each surface traced by the grey line is the output of a T Tauri model, in order of increasing height and radial extent they have disk masses of 10−4, 10−3, 10−2, and 10−1 M⊙. The shaded red curve shows the best-fit parametric model fitted to the molecular surface, from where rtaper is the taper radius. The measured z/r is obtained by fitting the surface region within 80% of rtaper, this distance is indicated by the vertical dashed line. The characteristic z/r is traced by the straight black line for each surface.
Current usage metrics show cumulative count of Article Views (full-text article views including HTML views, PDF and ePub downloads, according to the available data) and Abstracts Views on Vision4Press platform.
Data correspond to usage on the plateform after 2015. The current usage metrics is available 48-96 hours after online publication and is updated daily on week days.
Initial download of the metrics may take a while.