Fig. 2
Download original image
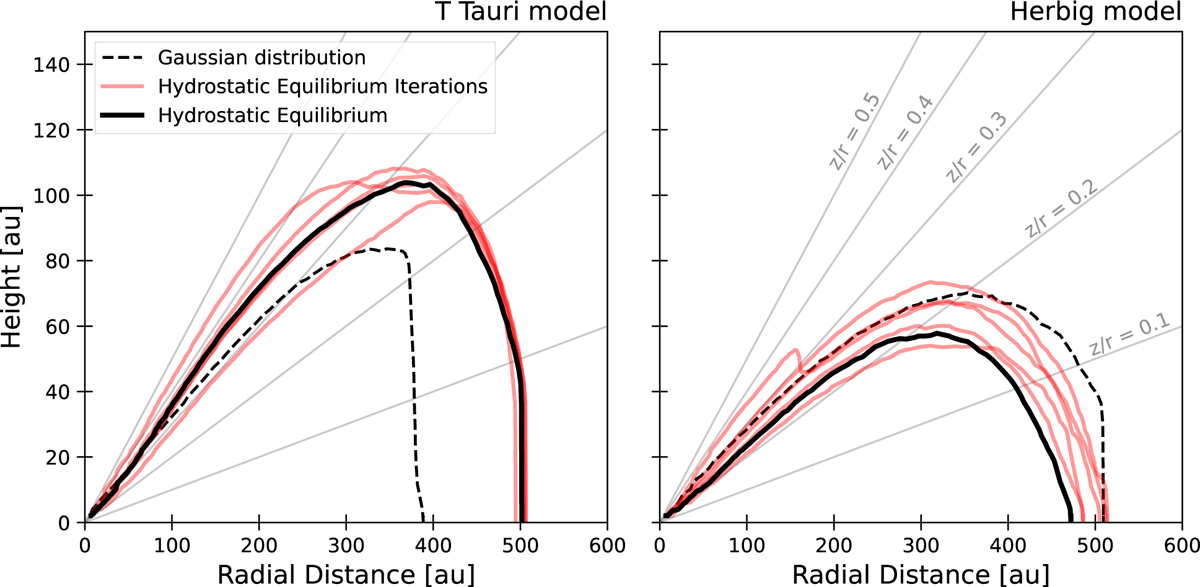
Variation of the 12CO τ = 1 surface when considering the hydrostatic equilibrium model solutions. The left panel shows the output for a T Tauri system and Right panel the results for a Herbig system. Both models correspond to a disk mass of 10−2 M⊙. The dashed lines trace the surface from the parametric Gaussian distribution and the solid black line shows the final hydrostatic equilibrium solution considered. Each red line represents a model iteration of hydrostatic equilibrium in DALI.
Current usage metrics show cumulative count of Article Views (full-text article views including HTML views, PDF and ePub downloads, according to the available data) and Abstracts Views on Vision4Press platform.
Data correspond to usage on the plateform after 2015. The current usage metrics is available 48-96 hours after online publication and is updated daily on week days.
Initial download of the metrics may take a while.