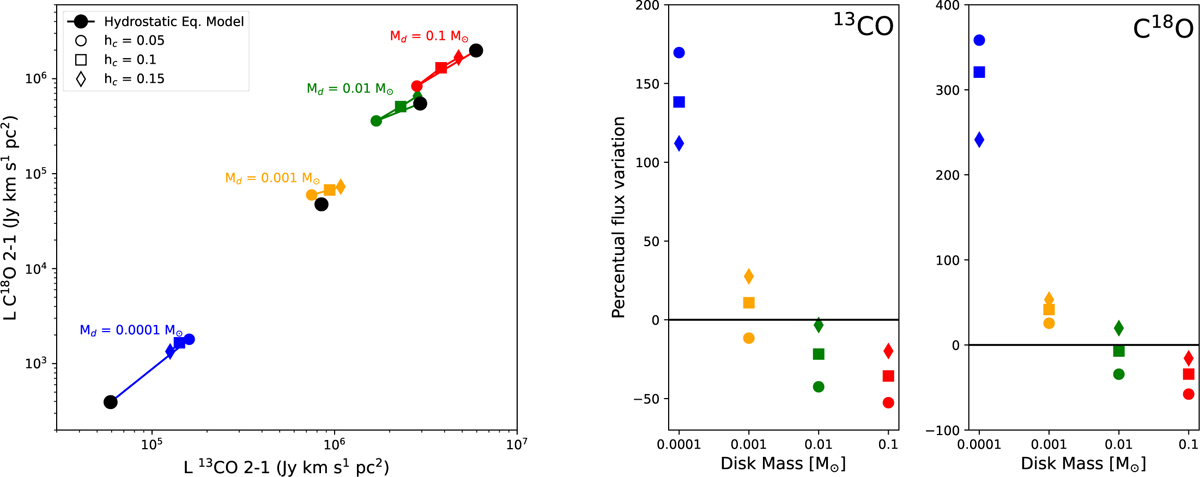
Fig. C.1
Download original image
Comparison of retrieved fluxes from DALI models when using hydrostatic equilibrium and not. The left panel shows the 13CO and C18O emission fluxes, black dots correspond to models obtained after iterating and solving the hydrostatic equilibrium equations. Colored dots show the fluxes from models with a single iteration using a static Gaussian material distribution. The right two panels display the percentage variation of the model flux from the static models, compared to the one which uses hydrostatic equilibrium to determine its thermal and density structure.
Current usage metrics show cumulative count of Article Views (full-text article views including HTML views, PDF and ePub downloads, according to the available data) and Abstracts Views on Vision4Press platform.
Data correspond to usage on the plateform after 2015. The current usage metrics is available 48-96 hours after online publication and is updated daily on week days.
Initial download of the metrics may take a while.