Fig. 1
Download original image
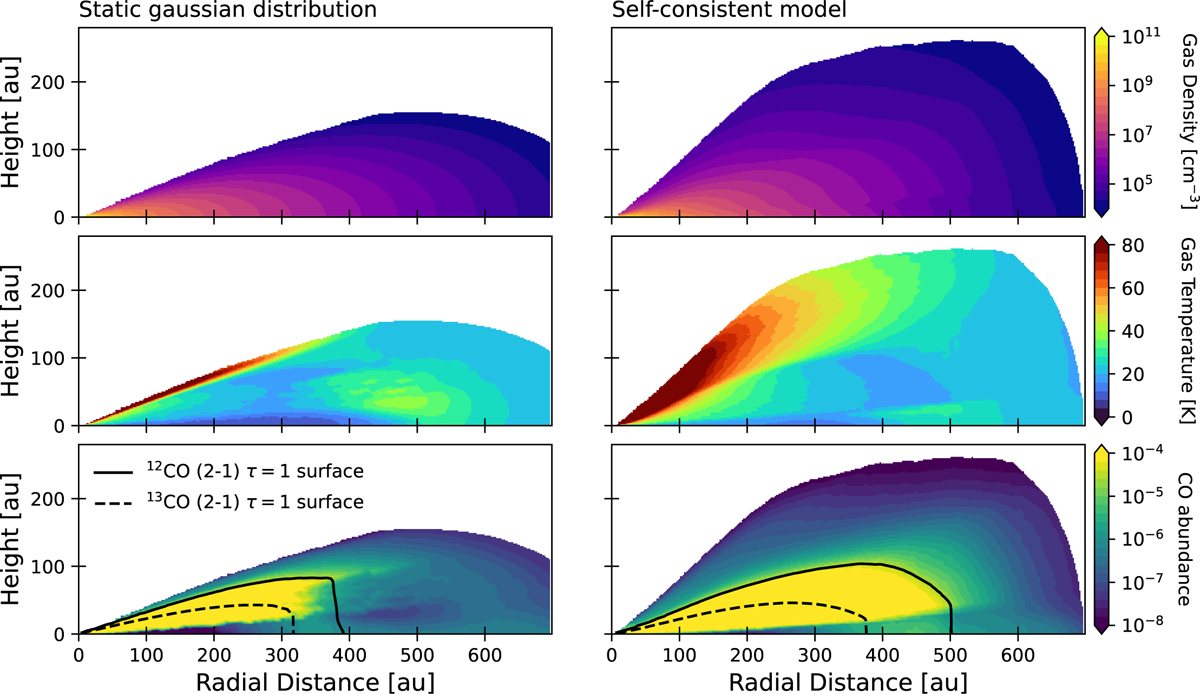
Comparison between the outputs of a vertically static Gaussian distribution (left column) and a model after solving self-consistently for the vertical material distribution (right column). Each row shows the 2D distribution of key parameters, displayed using the same colorbar. From top to bottom, the volumetric gas density, gas temperature, and CO abundance (relative to H2) are shown. In the bottom row, the solid line traces the 12CO τ = 1 surface and the dashed line the 13CO τ = 1 surface. These outputs are from our fiducial T Tauri star model with a 10−2 M⊙ disk.
Current usage metrics show cumulative count of Article Views (full-text article views including HTML views, PDF and ePub downloads, according to the available data) and Abstracts Views on Vision4Press platform.
Data correspond to usage on the plateform after 2015. The current usage metrics is available 48-96 hours after online publication and is updated daily on week days.
Initial download of the metrics may take a while.