Fig. 8
Download original image
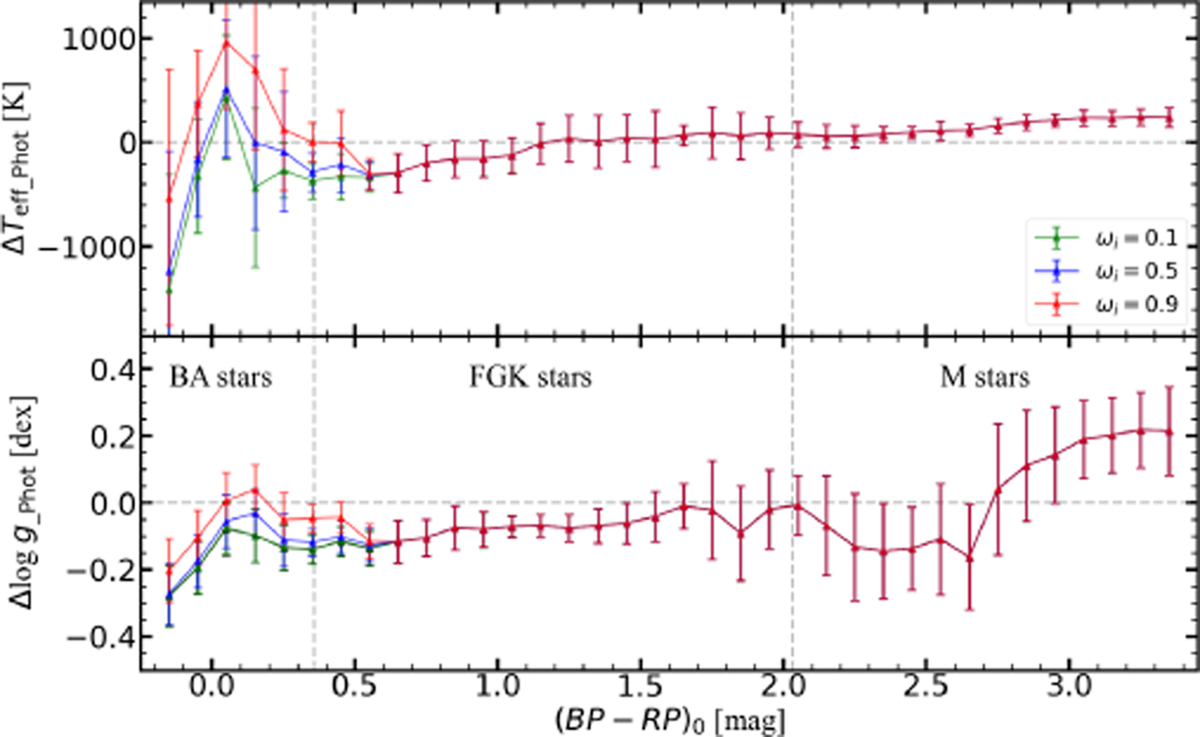
Deviation between the Teff (upper panel) and log g (lower panel) obtained by GSP-Phot and the theoretical values of the isochrone models with different degrees of stellar rotation. The green, yellow, and red lines represent, respectively, the deviations from the theoretical isochrones with rotational angular velocities of ωi = 0.1, 0.5, and 0.9. The error bars denote the degree of dispersion in each color bin.
Current usage metrics show cumulative count of Article Views (full-text article views including HTML views, PDF and ePub downloads, according to the available data) and Abstracts Views on Vision4Press platform.
Data correspond to usage on the plateform after 2015. The current usage metrics is available 48-96 hours after online publication and is updated daily on week days.
Initial download of the metrics may take a while.