Open Access
Fig. 7
Download original image
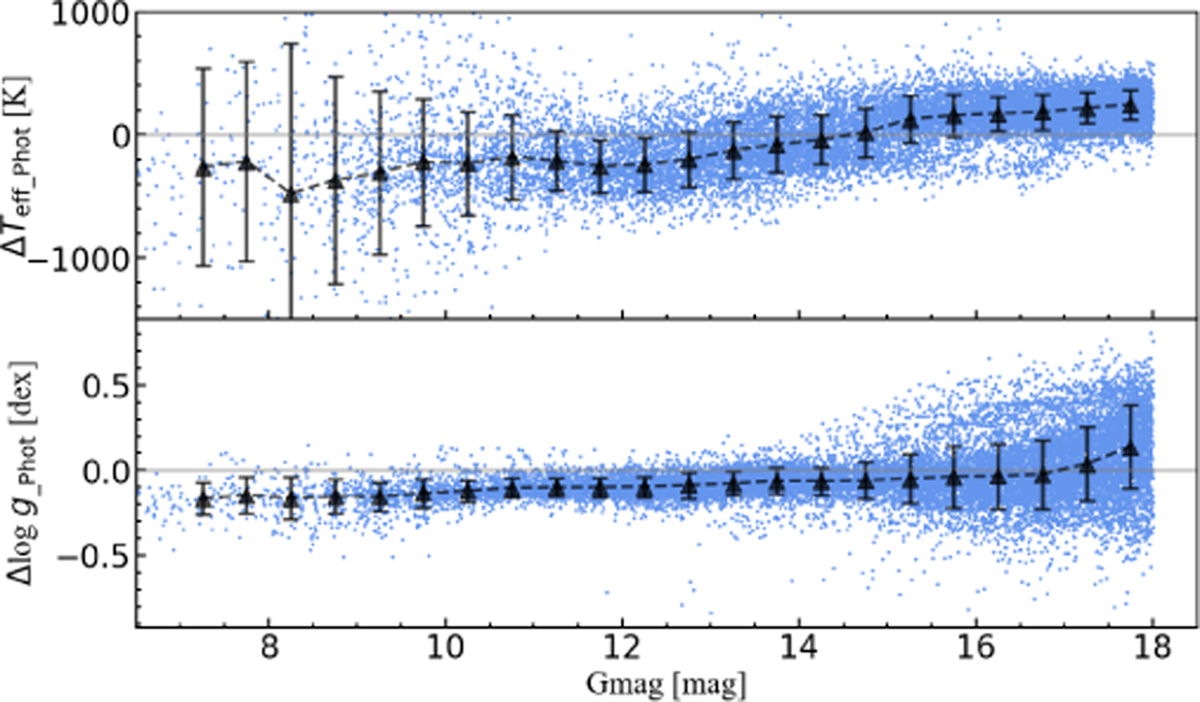
Top panel: ΔTeff_Phot vs. Gmag. Bottom panel: Δlog g_Phot vs. Gamg. The black triangles and error bars indicate the median values and corresponding dispersions within different color bins.
Current usage metrics show cumulative count of Article Views (full-text article views including HTML views, PDF and ePub downloads, according to the available data) and Abstracts Views on Vision4Press platform.
Data correspond to usage on the plateform after 2015. The current usage metrics is available 48-96 hours after online publication and is updated daily on week days.
Initial download of the metrics may take a while.