Open Access
Fig. 2
Download original image
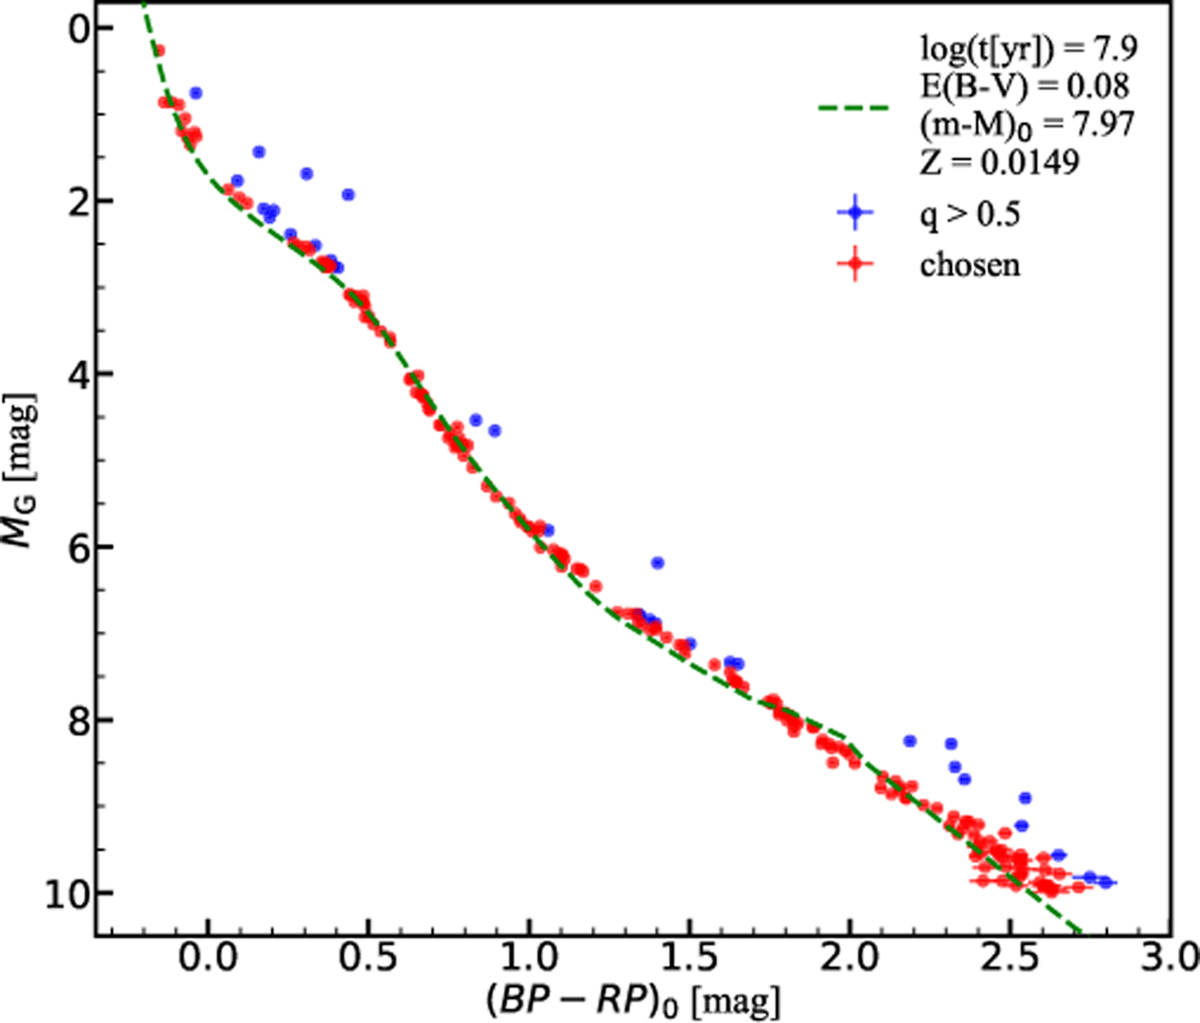
Color-absolute magnitude diagram of OCSN 259 (Roslund 6). The dashed green line represents the best-fit isochrone provided by Qin23. The blue dots represent the members with a binary mass ratio larger than 0.5. The red dots represent the member stars we have retained. The error bars indicate the photometric uncertainties.
Current usage metrics show cumulative count of Article Views (full-text article views including HTML views, PDF and ePub downloads, according to the available data) and Abstracts Views on Vision4Press platform.
Data correspond to usage on the plateform after 2015. The current usage metrics is available 48-96 hours after online publication and is updated daily on week days.
Initial download of the metrics may take a while.