Fig. 11
Download original image
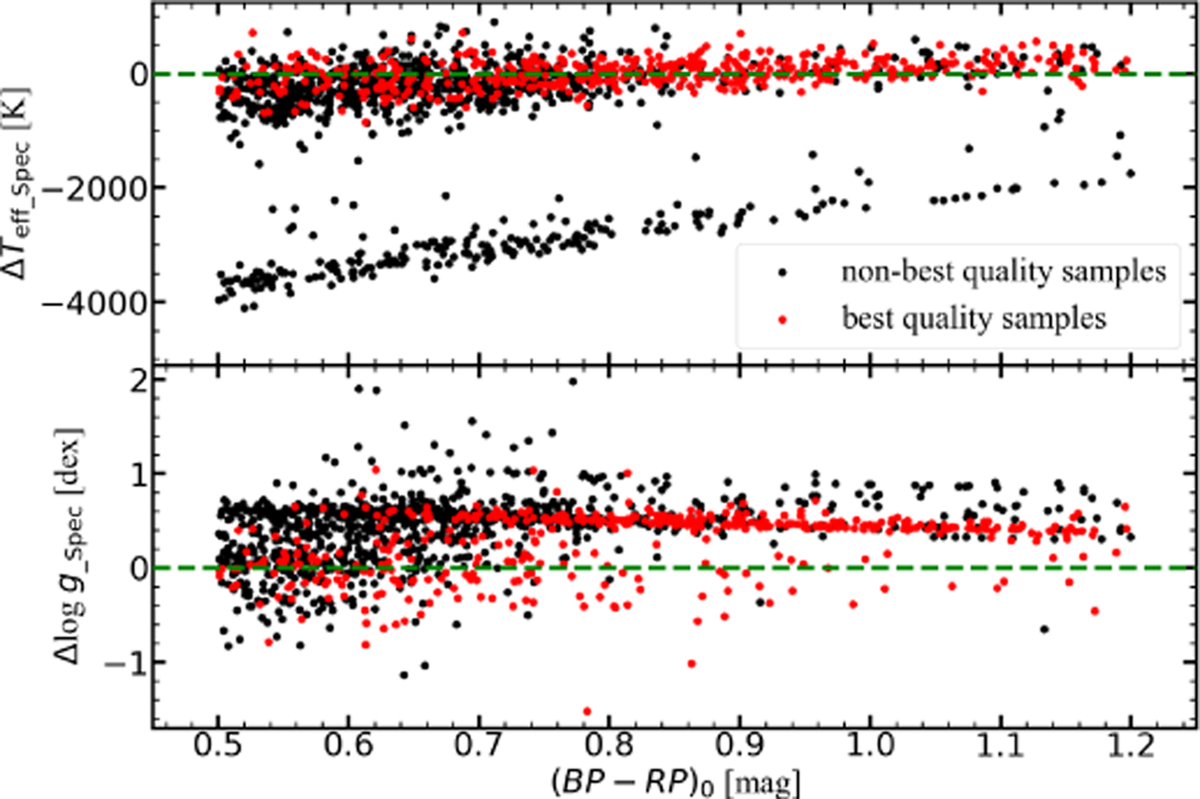
Distribution of the deviations of Teff_Spec and log g_Spec for different quality flags in GSP-Spec. The red dots represent the highestquality samples where f1, f2, f3, f4, f5, and f6 in the gspspec_flags are all equal to 0, and the black dots represent the low-quality samples where at least one of the flags f1, f2, f3, f4, f5, and f6 is not equal to 0.
Current usage metrics show cumulative count of Article Views (full-text article views including HTML views, PDF and ePub downloads, according to the available data) and Abstracts Views on Vision4Press platform.
Data correspond to usage on the plateform after 2015. The current usage metrics is available 48-96 hours after online publication and is updated daily on week days.
Initial download of the metrics may take a while.