Open Access
Fig. B.1.
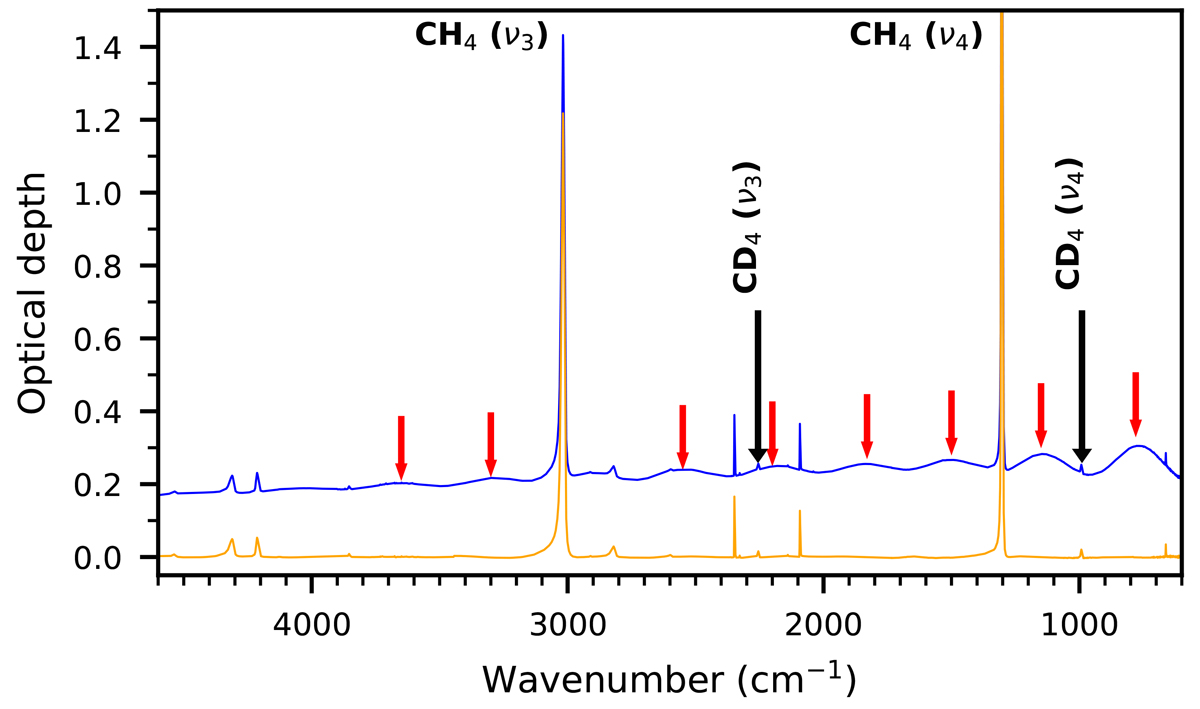
Download original image
Spectra of IF3. Blue curve: raw infrared spectrum of IF3. The CH4 and CD4ν3 and ν4 absorption features are visible. Periodic oscillations induced by reflections on the ice interfaces are indicated with red arrows. Orange curve: infrared spectrum of IF3 corrected from the periodic oscillations.
Current usage metrics show cumulative count of Article Views (full-text article views including HTML views, PDF and ePub downloads, according to the available data) and Abstracts Views on Vision4Press platform.
Data correspond to usage on the plateform after 2015. The current usage metrics is available 48-96 hours after online publication and is updated daily on week days.
Initial download of the metrics may take a while.