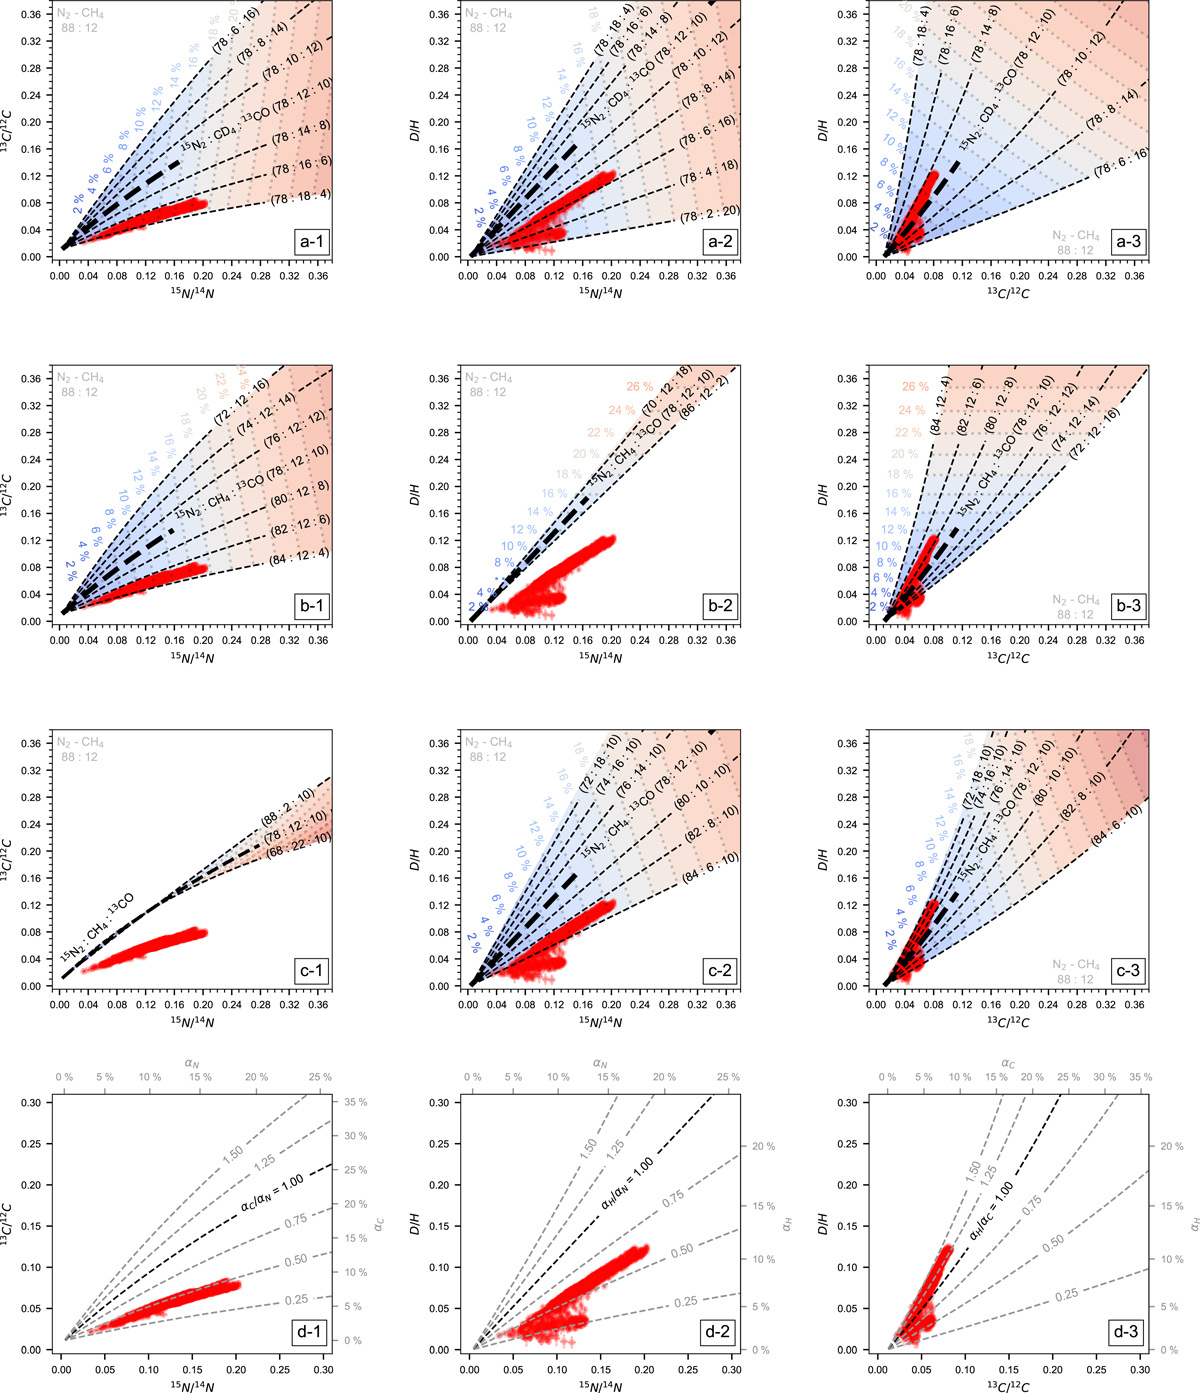
Fig. H.2.
Download original image
Comparison of the NanoSIMS data on OR7 (filled red circles) and the IF7 mixing lines derived from the mixing model. Columns 1, 2 and 3 show the 15N/14N vs, 13C/12C, 15N/14N vs D/H and 13C/12C vs D/H compositions, respectively. Row a, b and c: mixing lines for αN = αC = αH = α. Row a: the abundance of 15N2 is fixed and the abundances of CD4 and 13CO are varying. Row b: the abundance of CD4 is fixed and the abundances of 15N2 and 13CO are varying. Row c: the abundance of 13CO is fixed and the abundances of 15N2 and CD4 are varying. The value of α is indicated by the blue to red color contours. IF mixing lines with varying labeled layer compositions are displayed with dashed lines. The composition of the unlabeled ice is indicated in gray. Row d: the composition of IF7 is fixed and the mixing factors αN, αC, αH are set as free parameters. The value of the mixing factors are given by the gray scale on the top and right axes. The nominal mixing lines are plotted with bold dotted lines.
Current usage metrics show cumulative count of Article Views (full-text article views including HTML views, PDF and ePub downloads, according to the available data) and Abstracts Views on Vision4Press platform.
Data correspond to usage on the plateform after 2015. The current usage metrics is available 48-96 hours after online publication and is updated daily on week days.
Initial download of the metrics may take a while.