Fig. 7.

Download original image
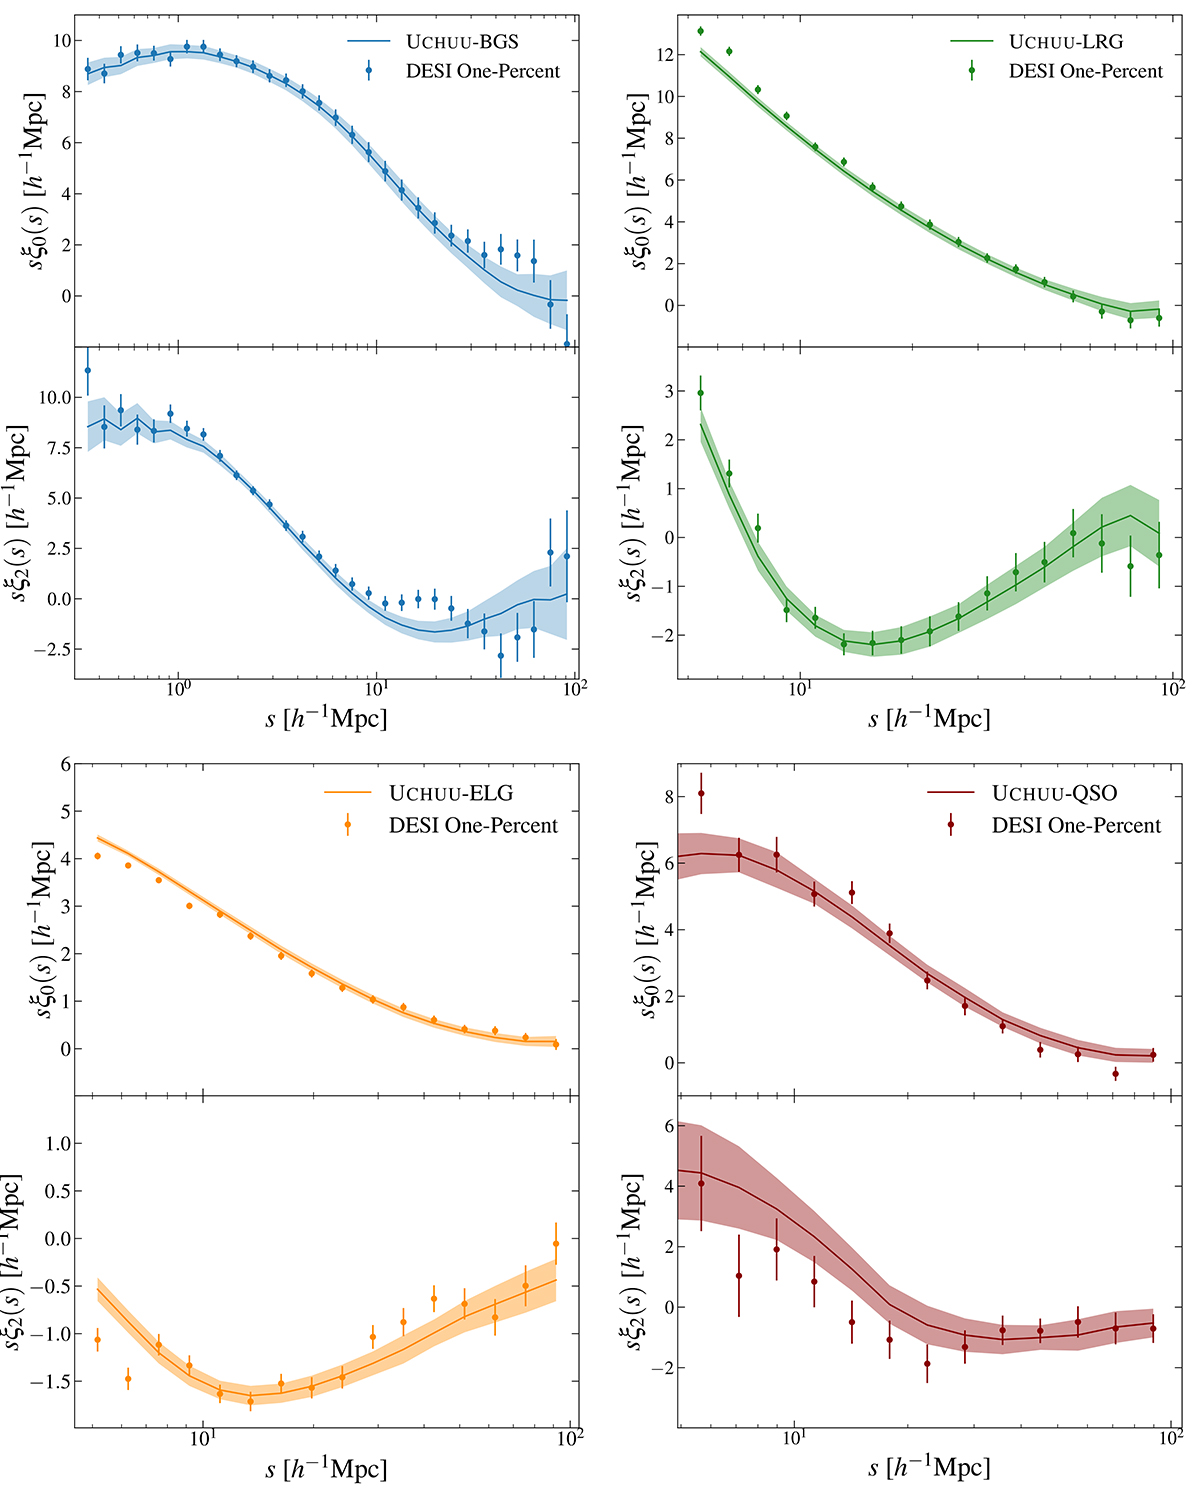
Measurements of the monopole and quadrupole of the redshift-space correlation function for all four tracers from the DESI One-Percent samples, in the redshift intervals 0.1<z<0.3 (BGS), 0.45<z<0.85 (LRG), 0.88<z<1.34 (ELG), and 0.9<z<2.1 (QSO). The theoretical predictions from the mean of the independent UCHUU-DESI lightcones generated for each tracer are shown as solid curves, while the shaded areas correspond to the error from the RMS of the 102 mocks. The clustering measurements for the BGS, LRG, ELG and QSO are shown in blue, green, orange and red, respectively, with the monopole and quadrupole shown in the upper and lower panels. The points with error bars represent the measurements from the DESI One-Percent Survey.
Current usage metrics show cumulative count of Article Views (full-text article views including HTML views, PDF and ePub downloads, according to the available data) and Abstracts Views on Vision4Press platform.
Data correspond to usage on the plateform after 2015. The current usage metrics is available 48-96 hours after online publication and is updated daily on week days.
Initial download of the metrics may take a while.


