Fig. 3.
Download original image
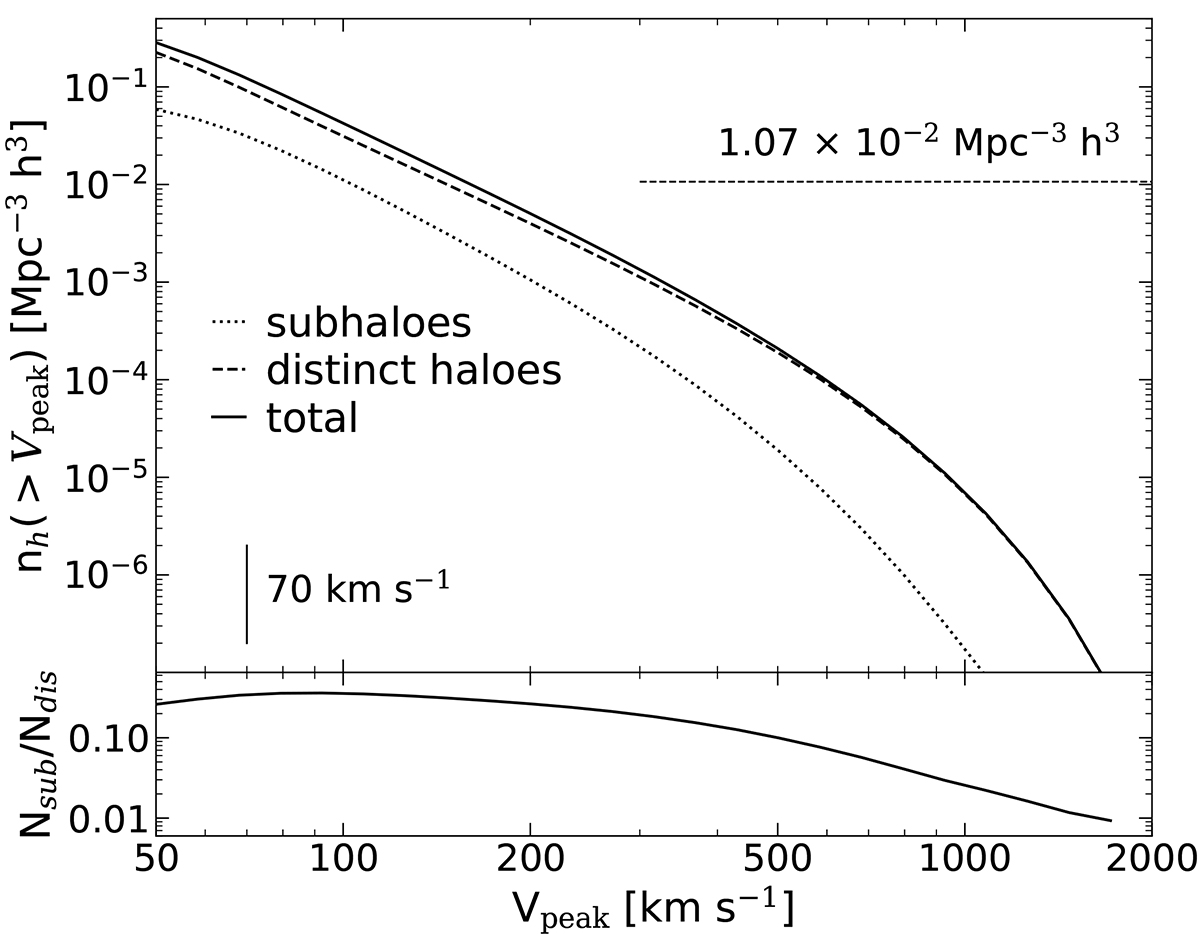
Top panel: Cumulative number density of distinct haloes (Ndis) (dashed curve), subhaloes (Nsub) (dotted curve), and all haloes (solid curve) as a function Vpeak in the UCHUU simulation box at z = 0.2, the median redshift of the BGS-BRIGHT sample in the DESI One-Percent Survey. The horizontal line indicates the mean number density of the BGS-BRIGHT sample. The vertical line indicates the completeness threshold for UCHUU. Bottom panel: Cumulative subhalo fraction measured as a function of Vpeak.
Current usage metrics show cumulative count of Article Views (full-text article views including HTML views, PDF and ePub downloads, according to the available data) and Abstracts Views on Vision4Press platform.
Data correspond to usage on the plateform after 2015. The current usage metrics is available 48-96 hours after online publication and is updated daily on week days.
Initial download of the metrics may take a while.