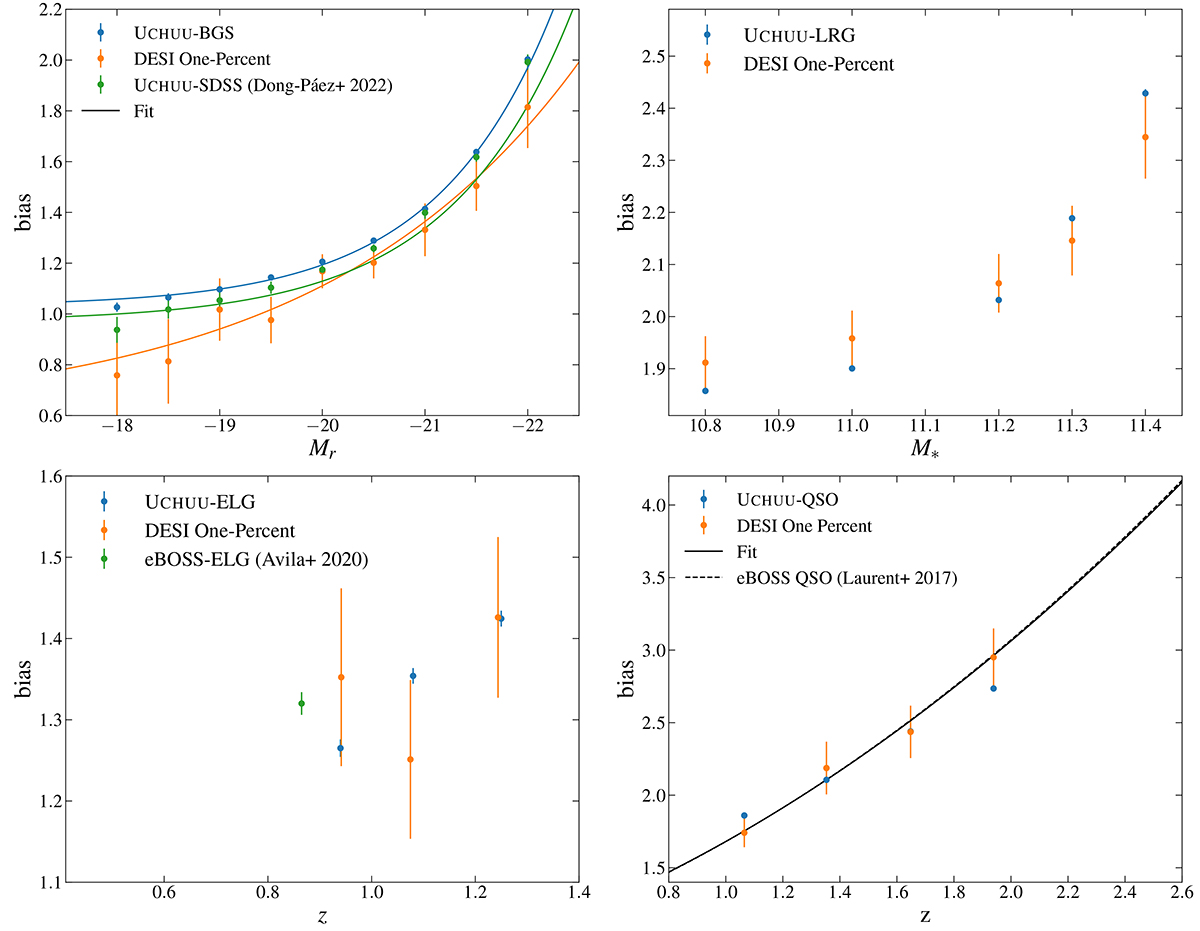
Fig. 16.
Download original image
Top left: Bias of the BGS magnitude threshold volume-limited samples, at the median redshift of each sample. Blue points indicate the mean bias measured from the 102 UCHUU-BGS lightcones, where the small error bars are the error on the mean. Orange points show the bias measured from the BGS One-Percent Survey clustering measurements, where the errors are the 1σ scatter between the lightcones. The green points show bias measurements from the UCHUU mock, but cut to the SDSS volume limited samples, with redshift limits provided in Table 2 of Zehavi et al. (2011). The lines show our fits to these bias measurements as a function of magnitude using Equation (12). Top right: The same as the top left panel, but showing the bias measurements for the LRG stellar mass threshold samples. Bottom left: QSO bias measurements as a function of redshift. The black dashed lines show the parametric fit from Laurent et al. (2017), and the black solid line shows a similar fit to the DESI One-Percent data.
Current usage metrics show cumulative count of Article Views (full-text article views including HTML views, PDF and ePub downloads, according to the available data) and Abstracts Views on Vision4Press platform.
Data correspond to usage on the plateform after 2015. The current usage metrics is available 48-96 hours after online publication and is updated daily on week days.
Initial download of the metrics may take a while.