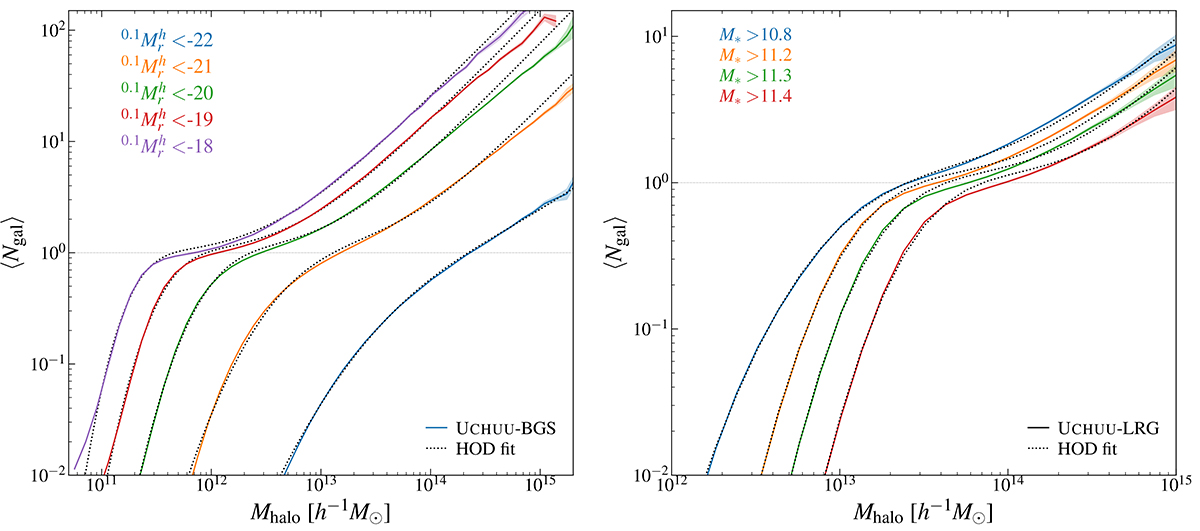
Fig. 14.
Download original image
Same as Figure 13 but showing the HODs for several BGS BRIGHT luminosity-threshold (left panel) and LRG stellar mass-threshold samples (right panel), selected from our UCHUU-DESI lightcones. The coloured curves show the HODs measured from the full-sky mock, where the sample is indicated in the legend, and the shaded area indicates the jackknife error, using 100 jackknife regions. The best-fitting 5-parameter HOD model for each sample is shown by the black dotted curves. HOD model parameters are provided in Tables 4 and 5 for the BGS and LRG samples, respectively.
Current usage metrics show cumulative count of Article Views (full-text article views including HTML views, PDF and ePub downloads, according to the available data) and Abstracts Views on Vision4Press platform.
Data correspond to usage on the plateform after 2015. The current usage metrics is available 48-96 hours after online publication and is updated daily on week days.
Initial download of the metrics may take a while.