Fig. 12.
Download original image
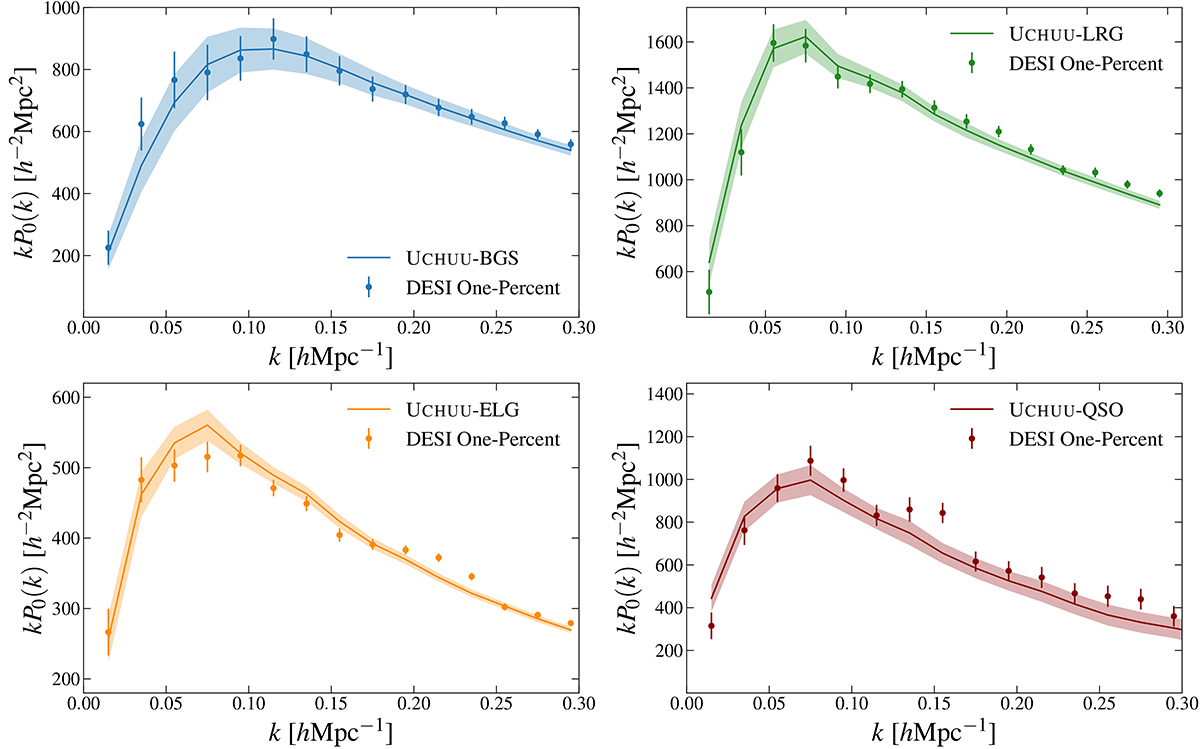
Power spectrum monopole and quadrupole measurements of the four DESI tracers, for the same samples as in Figure 7. The BGS, LRG, ELG and QSO samples are shown in blue, green, orange and red, respectively, with the power spectrum monopole in the upper panels, and quadrupole in the lower panels. The solid lines and the points with error bars show the measurements from UCHUU and the One-Percent Survey data, respectively. Error bars represent the 1σ scatter between the 102 mocks.
Current usage metrics show cumulative count of Article Views (full-text article views including HTML views, PDF and ePub downloads, according to the available data) and Abstracts Views on Vision4Press platform.
Data correspond to usage on the plateform after 2015. The current usage metrics is available 48-96 hours after online publication and is updated daily on week days.
Initial download of the metrics may take a while.