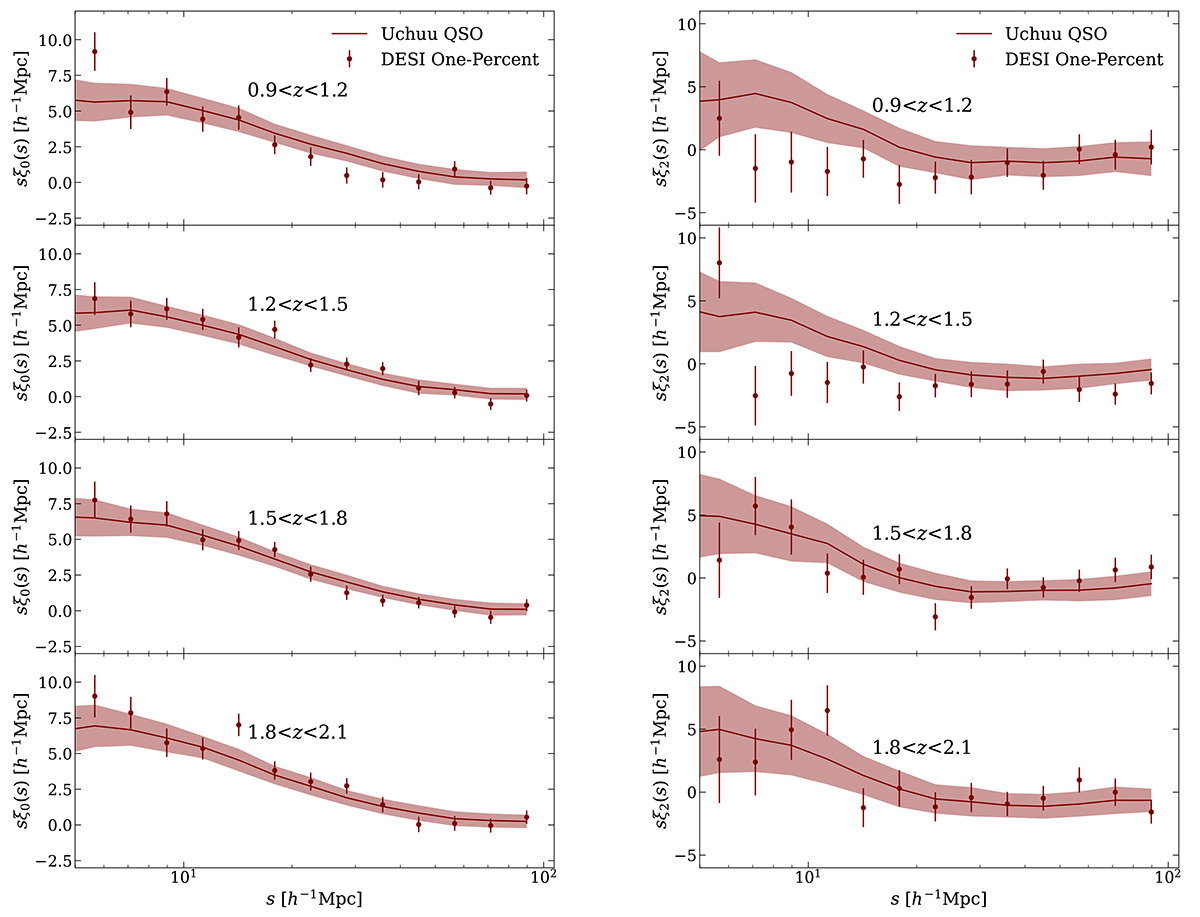
Fig. 11.
Download original image
Clustering measurements for monopole (left panels) and quadrupole (right panels) of the DESI One-Percent QSO sample in redshift bins. The solid curves show the mean of the Uchuu mocks, and the shaded region is the error from their RMS. Data clustering measurements are indicated by the points with error bars, where the errors are the 1σ scatter between the mocks.
Current usage metrics show cumulative count of Article Views (full-text article views including HTML views, PDF and ePub downloads, according to the available data) and Abstracts Views on Vision4Press platform.
Data correspond to usage on the plateform after 2015. The current usage metrics is available 48-96 hours after online publication and is updated daily on week days.
Initial download of the metrics may take a while.