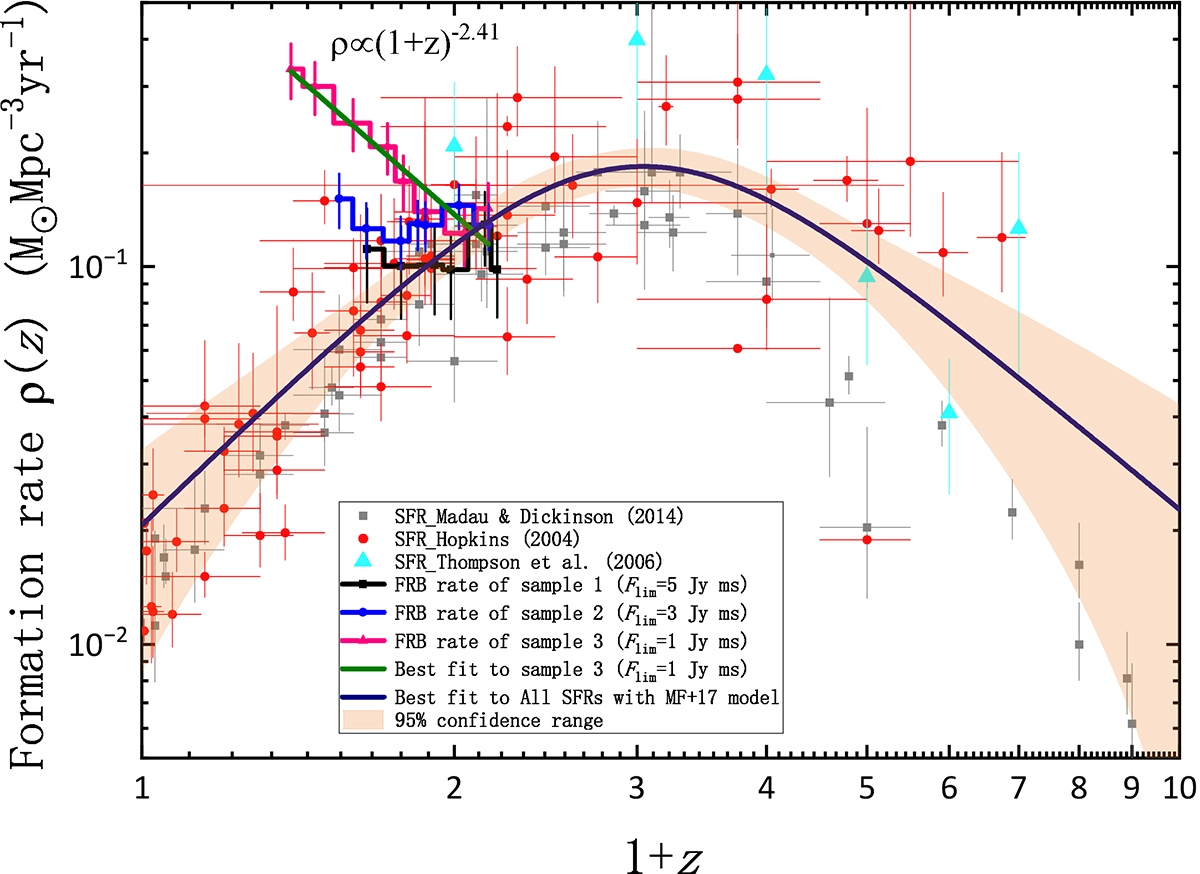
Fig. 7.
Download original image
Formation rate, ρ(z), of CHIME FRBs and the SFR versus redshift. The thick blue curve and the shaded regions show, respectively, the best fit of SFR = 0.02(1 + z)2.65/[1 + ((1 + z)/2.95)4.93] with the theoretical model in Madau & Fragos (2017) and a 2σ confidence level. Grey squares, blue upward triangles, and red circles represent the observed SFR taken from Madau & Dickinson (2014), Thompson et al. (2006) and Hopkins (2004), respectively. The three thick step lines denote the FRB event rates of the three samples. The best fit to sample 3 is displayed by the solid green line.
Current usage metrics show cumulative count of Article Views (full-text article views including HTML views, PDF and ePub downloads, according to the available data) and Abstracts Views on Vision4Press platform.
Data correspond to usage on the plateform after 2015. The current usage metrics is available 48-96 hours after online publication and is updated daily on week days.
Initial download of the metrics may take a while.