Fig. 8.
Download original image
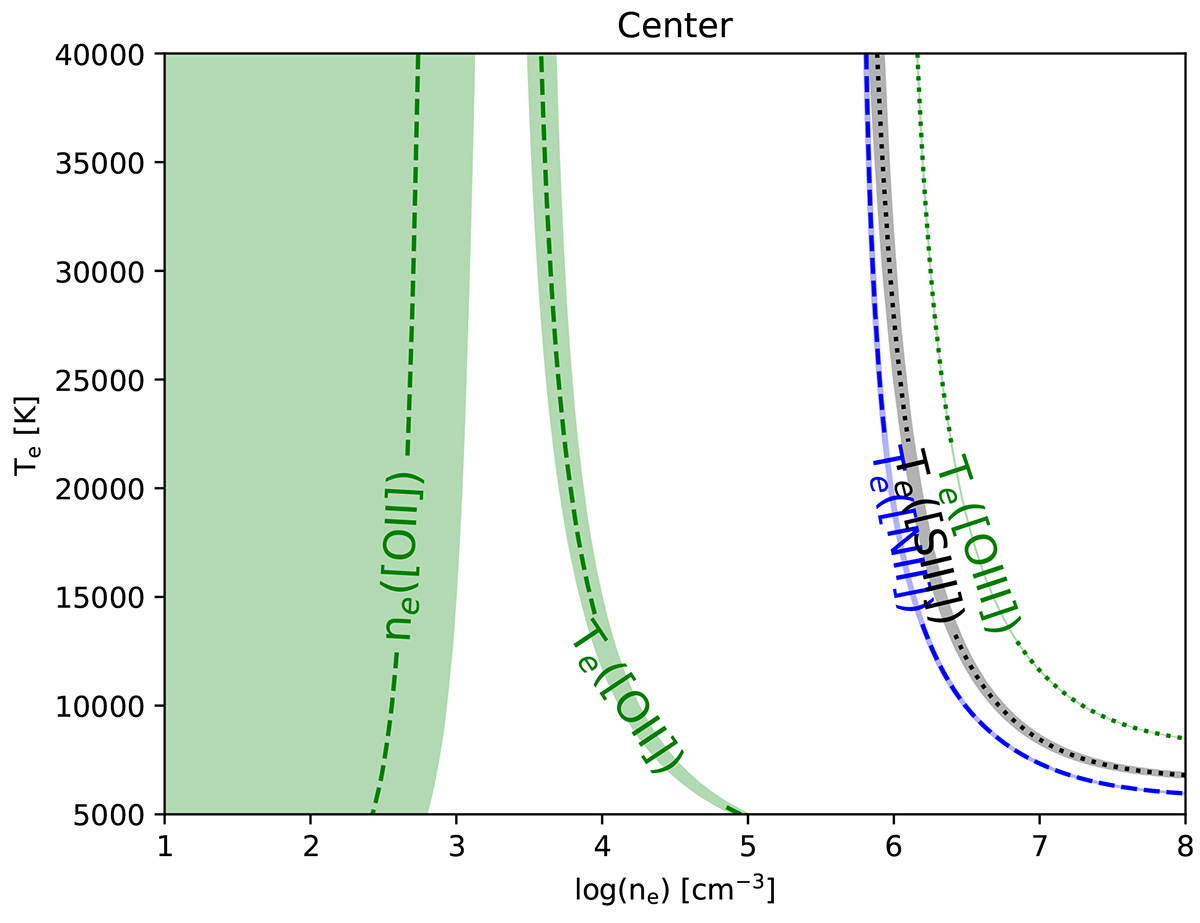
Temperature and density solutions from PyNeb for the spectrum extracted from the center region in Figure 3. Oxygen, sulphur, and nitrogen diagnostics are depicted in green, grey, and blue colors, respectively, with shades representing the 1-σ confidence regions. We note that the Te [O II] diagnostic shown here might not be trustworthy, if indeed the [O II]λλ3727,3730 emission has a different region of origin than its auroral counterpart (see Section 3.2, Section 4.3). Similar figures for the surrounding regions are shown in Figure C.2.
Current usage metrics show cumulative count of Article Views (full-text article views including HTML views, PDF and ePub downloads, according to the available data) and Abstracts Views on Vision4Press platform.
Data correspond to usage on the plateform after 2015. The current usage metrics is available 48-96 hours after online publication and is updated daily on week days.
Initial download of the metrics may take a while.