Fig. 7.
Download original image
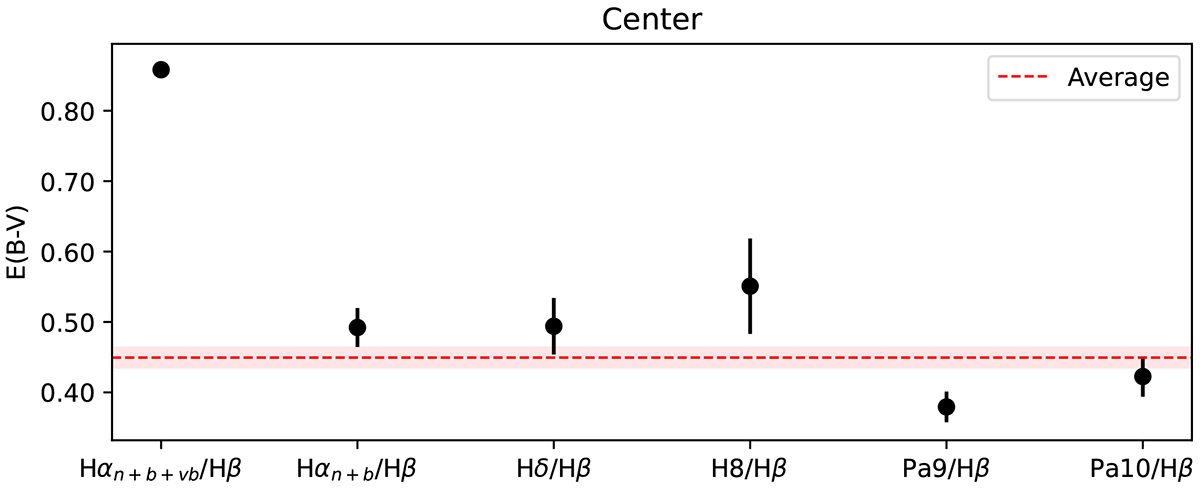
E(B − V) as computed from the strongest Balmer and Paschen lines for the central region. The value from Hα is shown both including and excluding the very broad component. The average weighted by inverse of error is shown in red-dashed horizontal line with a shade representing 1σ uncertainty. Similar figures for the surrounding regions are shown in Figure C.1.
Current usage metrics show cumulative count of Article Views (full-text article views including HTML views, PDF and ePub downloads, according to the available data) and Abstracts Views on Vision4Press platform.
Data correspond to usage on the plateform after 2015. The current usage metrics is available 48-96 hours after online publication and is updated daily on week days.
Initial download of the metrics may take a while.