Open Access
Fig. 5.
Download original image
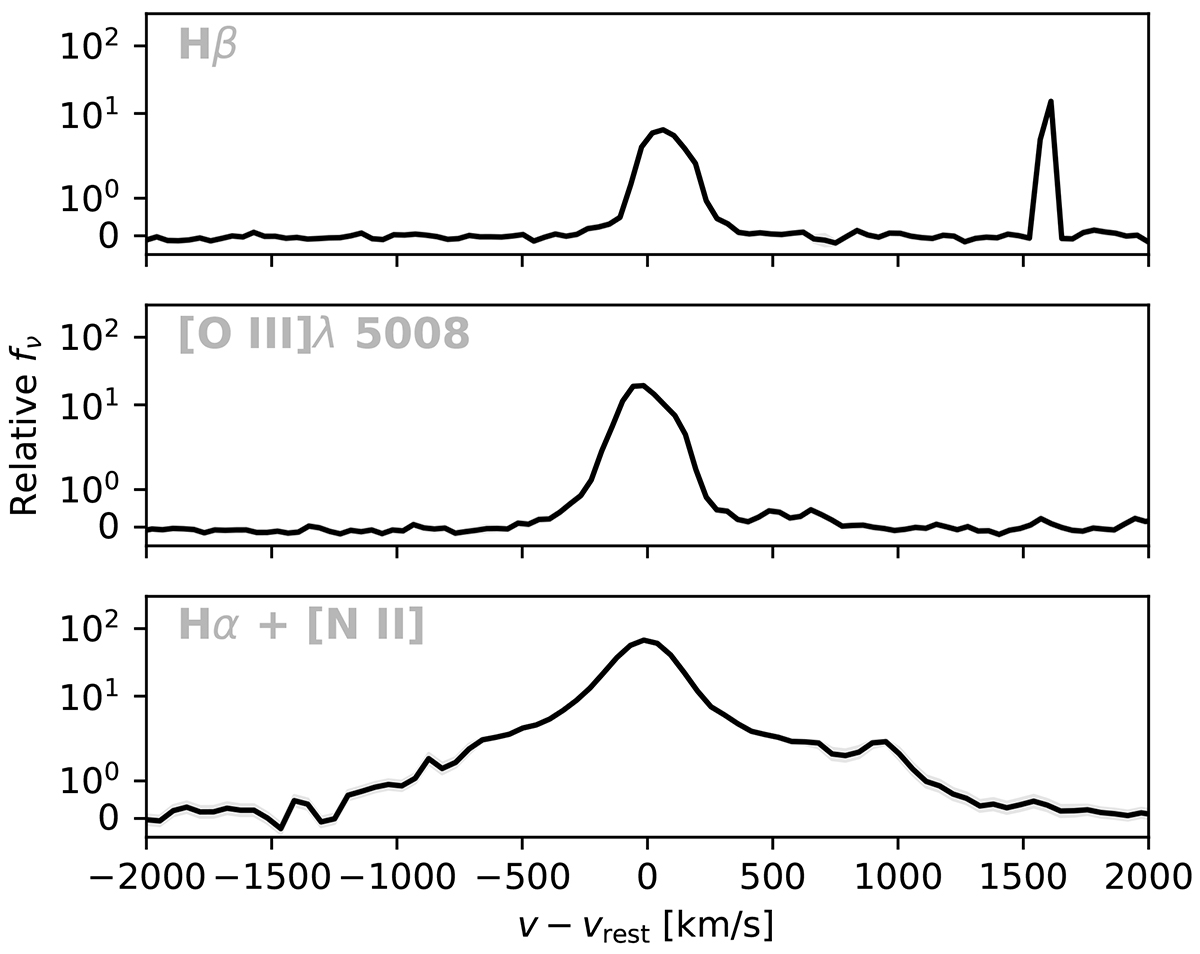
Line profiles of Hβ, [O III]5008, and Hα+[N II] of the center region, highlighting the broad component present in Hα but not the other lines. The y-axis scale is linear between –1 and 1, and logarithmic outside this interval. The velocity scale in the lower panel is centered around Hα.
Current usage metrics show cumulative count of Article Views (full-text article views including HTML views, PDF and ePub downloads, according to the available data) and Abstracts Views on Vision4Press platform.
Data correspond to usage on the plateform after 2015. The current usage metrics is available 48-96 hours after online publication and is updated daily on week days.
Initial download of the metrics may take a while.