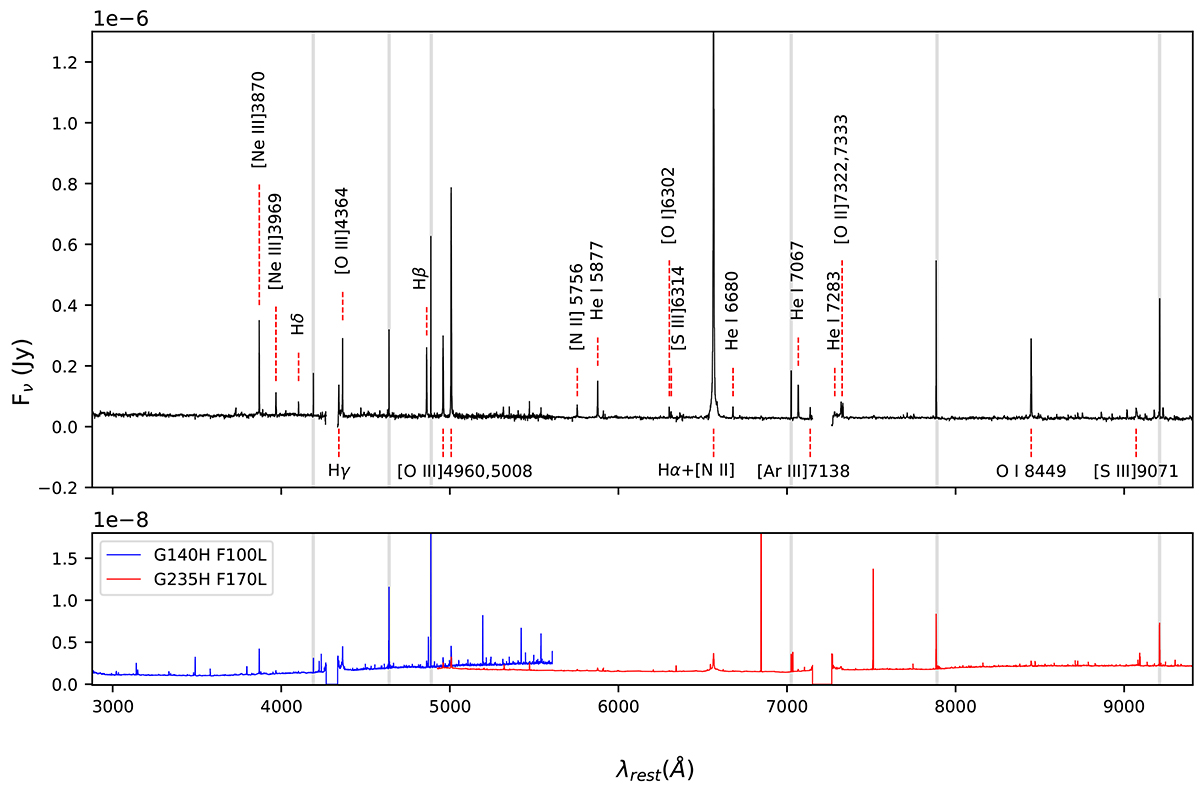
Fig. 4.
Download original image
Top: 1D spectrum extracted from the center region, labeled with prominent lines. Bottom: Corrected error from G140H/F100LP and G235H/F170LP gratings shown in blue and red, respectively. Noise pixels are marked with grey shades. Both flux density and errors from the two gratings are overlapped in ∼4925 − 5610 Å. See Figures B.1 and B.2 for more detailed features.
Current usage metrics show cumulative count of Article Views (full-text article views including HTML views, PDF and ePub downloads, according to the available data) and Abstracts Views on Vision4Press platform.
Data correspond to usage on the plateform after 2015. The current usage metrics is available 48-96 hours after online publication and is updated daily on week days.
Initial download of the metrics may take a while.