Fig. 3.
Download original image
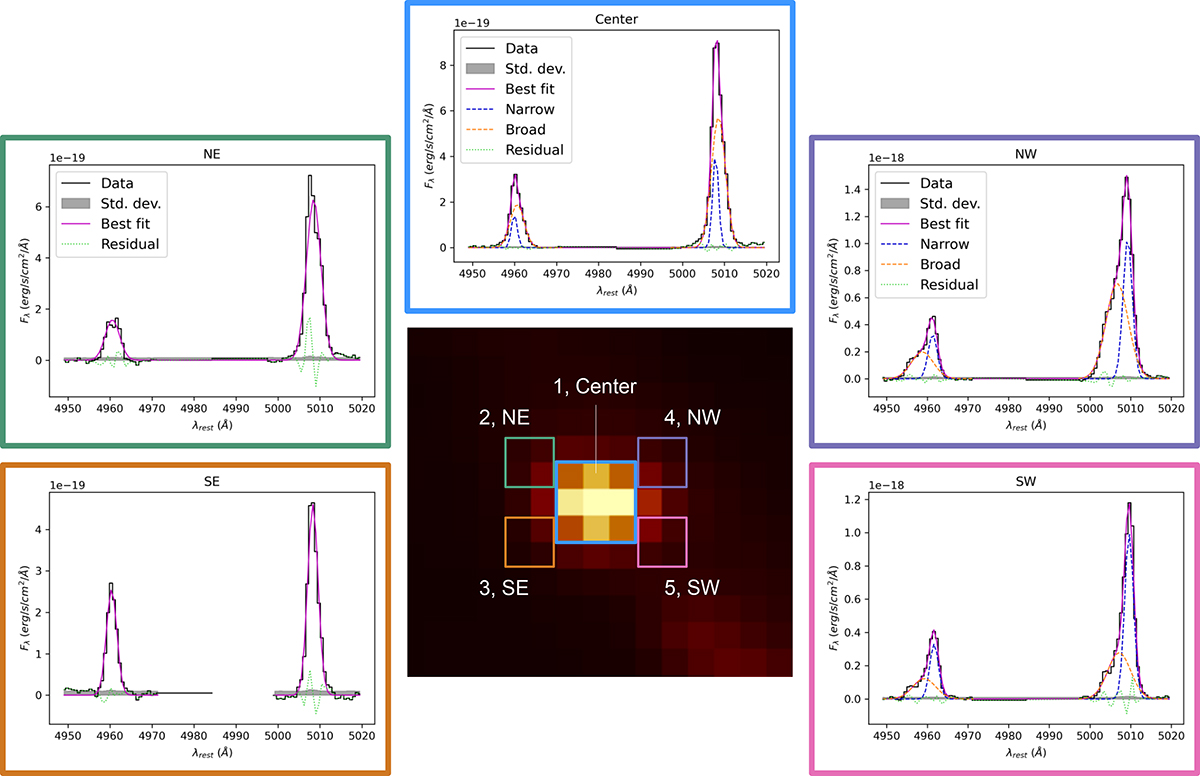
Five regions where spectra have been extracted and their [O III]λλ4960,5008 doublet line profiles in the G140H/F100LP grating. The center figure shows the wavelength-axis median image of the NIRSpec G140H/F100LP grating at the area of Godzilla. Two-component (center, NW, SW) and one-component (NE, SE) Gaussian fits are also shown.
Current usage metrics show cumulative count of Article Views (full-text article views including HTML views, PDF and ePub downloads, according to the available data) and Abstracts Views on Vision4Press platform.
Data correspond to usage on the plateform after 2015. The current usage metrics is available 48-96 hours after online publication and is updated daily on week days.
Initial download of the metrics may take a while.