Open Access
Fig. B.1.
Download original image
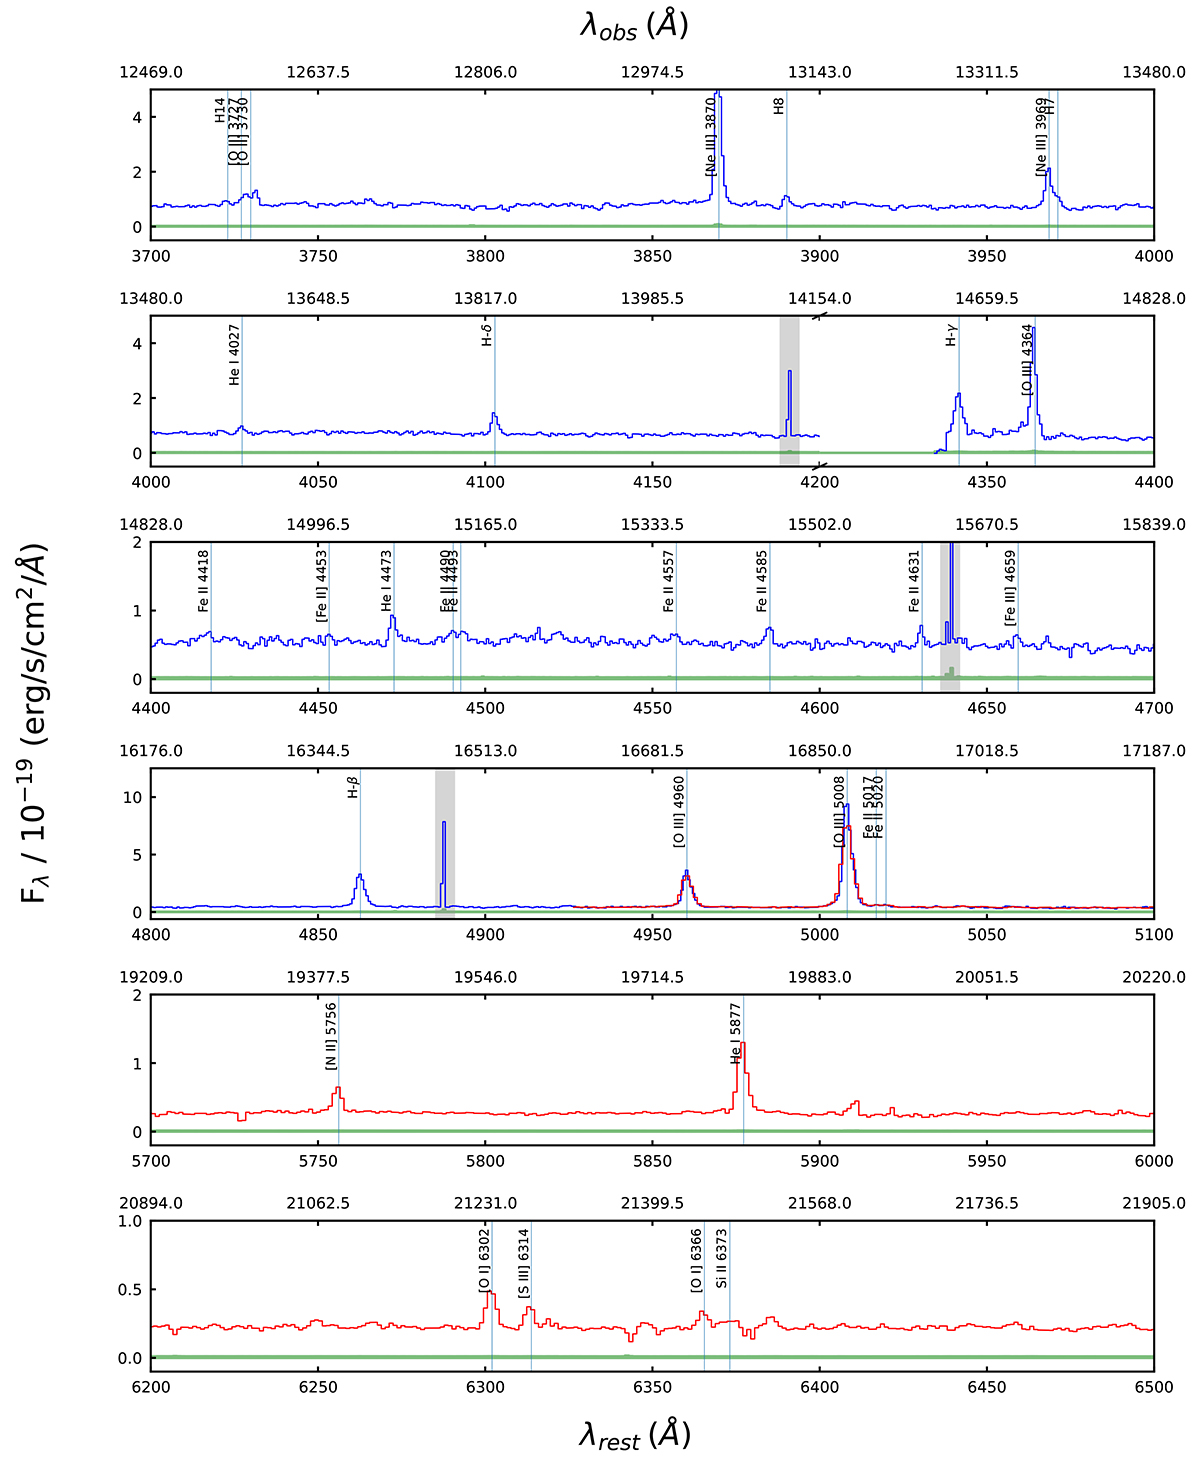
1D spectrum from the bright central region of Godzilla. Observed-frame flux densities from the G140H/F100LP and G235H/F170LP gratings are shown in blue and red solid lines, respectively. Standard deviation is shown with green area and hot/noisy pixels are marked with grey shades.
Current usage metrics show cumulative count of Article Views (full-text article views including HTML views, PDF and ePub downloads, according to the available data) and Abstracts Views on Vision4Press platform.
Data correspond to usage on the plateform after 2015. The current usage metrics is available 48-96 hours after online publication and is updated daily on week days.
Initial download of the metrics may take a while.