Fig. 13.
Download original image
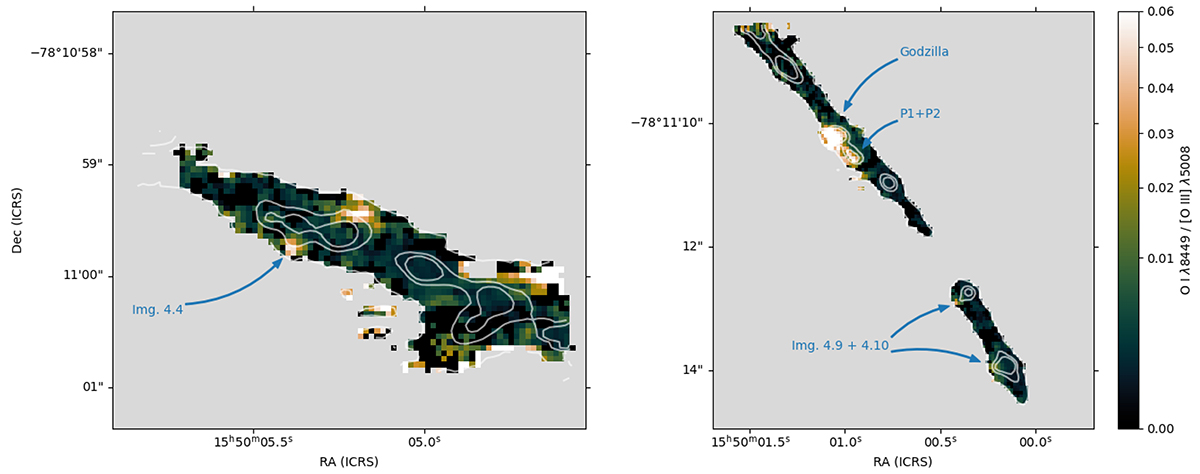
O Iλ8449/[O III]λ5008 map for Pointing 1 (left) and Pointings 2+3 (right), with the stellar continuum overlaid as contours. The O Iλ8449/[O III]λ5008 ratio is near zero in the images of clump 1 and is highest in the images of clump 4, Godzilla, and the P knots. Refer to Figure D.1 in the appendix to see the map normalized by Hβ.
Current usage metrics show cumulative count of Article Views (full-text article views including HTML views, PDF and ePub downloads, according to the available data) and Abstracts Views on Vision4Press platform.
Data correspond to usage on the plateform after 2015. The current usage metrics is available 48-96 hours after online publication and is updated daily on week days.
Initial download of the metrics may take a while.