Fig. 10.
Download original image
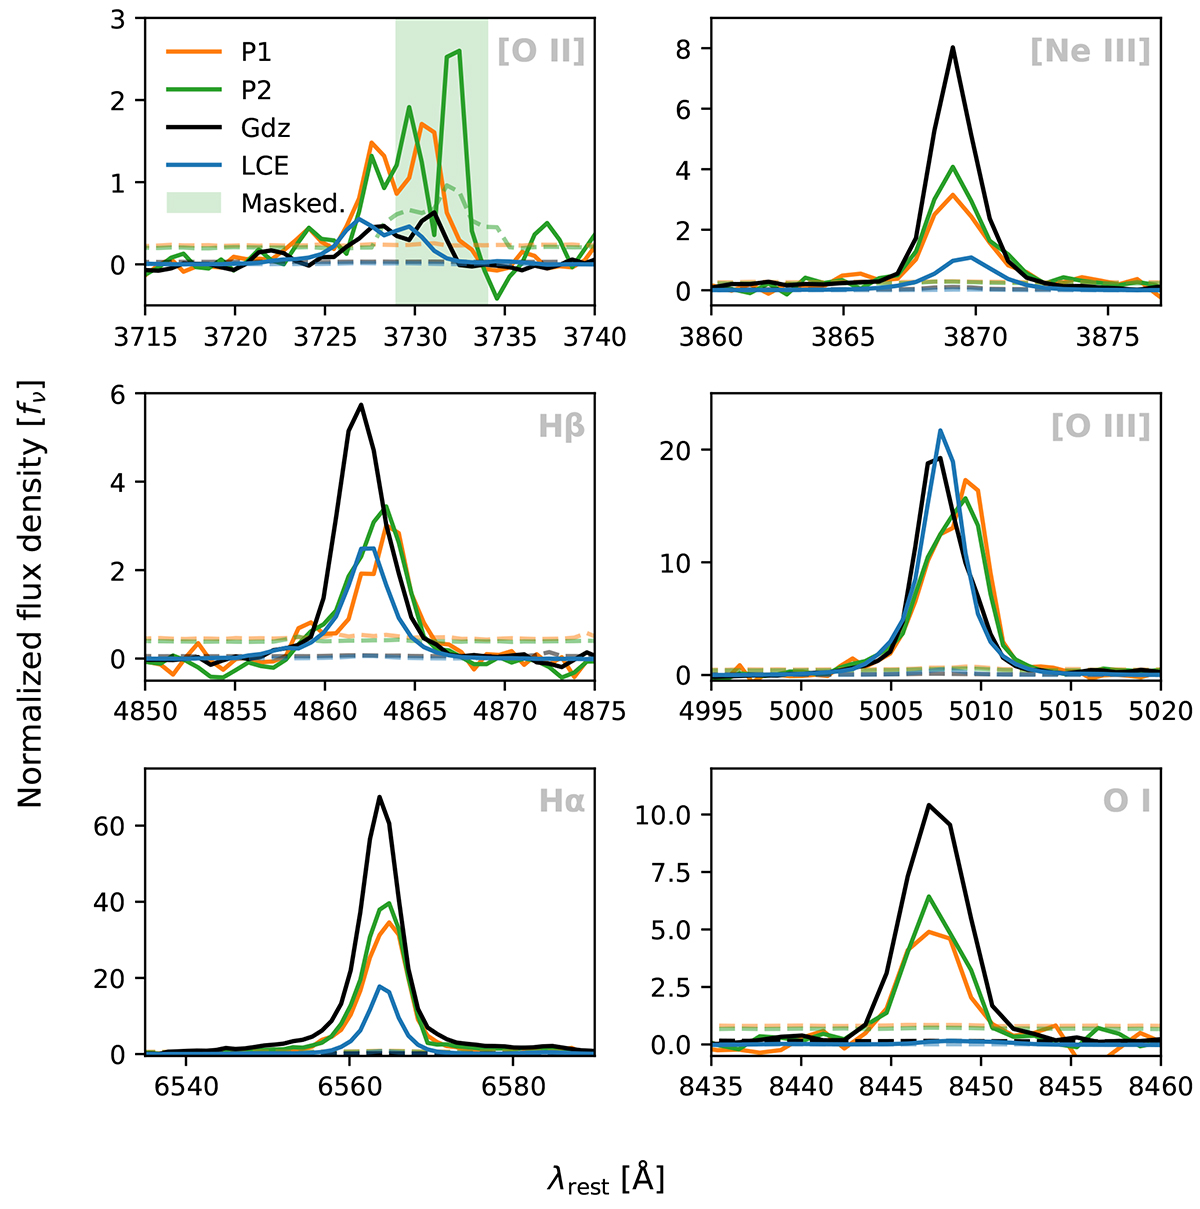
Selected relative line fluxes from Godzilla, the two P-knots, and for comparison the Lyman Continuum emitter (LCE) knot, highlighting kinematics and relative line strengths. The green shaded interval in the [O II] panel indicates where P2 suffers from contamination from noisy pixels. The spectra were first normalized by their median value, the continuum then subtracted, and the resulting lines all normalized by the integral of [O III] 5008 of each spectrum.
Current usage metrics show cumulative count of Article Views (full-text article views including HTML views, PDF and ePub downloads, according to the available data) and Abstracts Views on Vision4Press platform.
Data correspond to usage on the plateform after 2015. The current usage metrics is available 48-96 hours after online publication and is updated daily on week days.
Initial download of the metrics may take a while.