Fig. 8.
Download original image
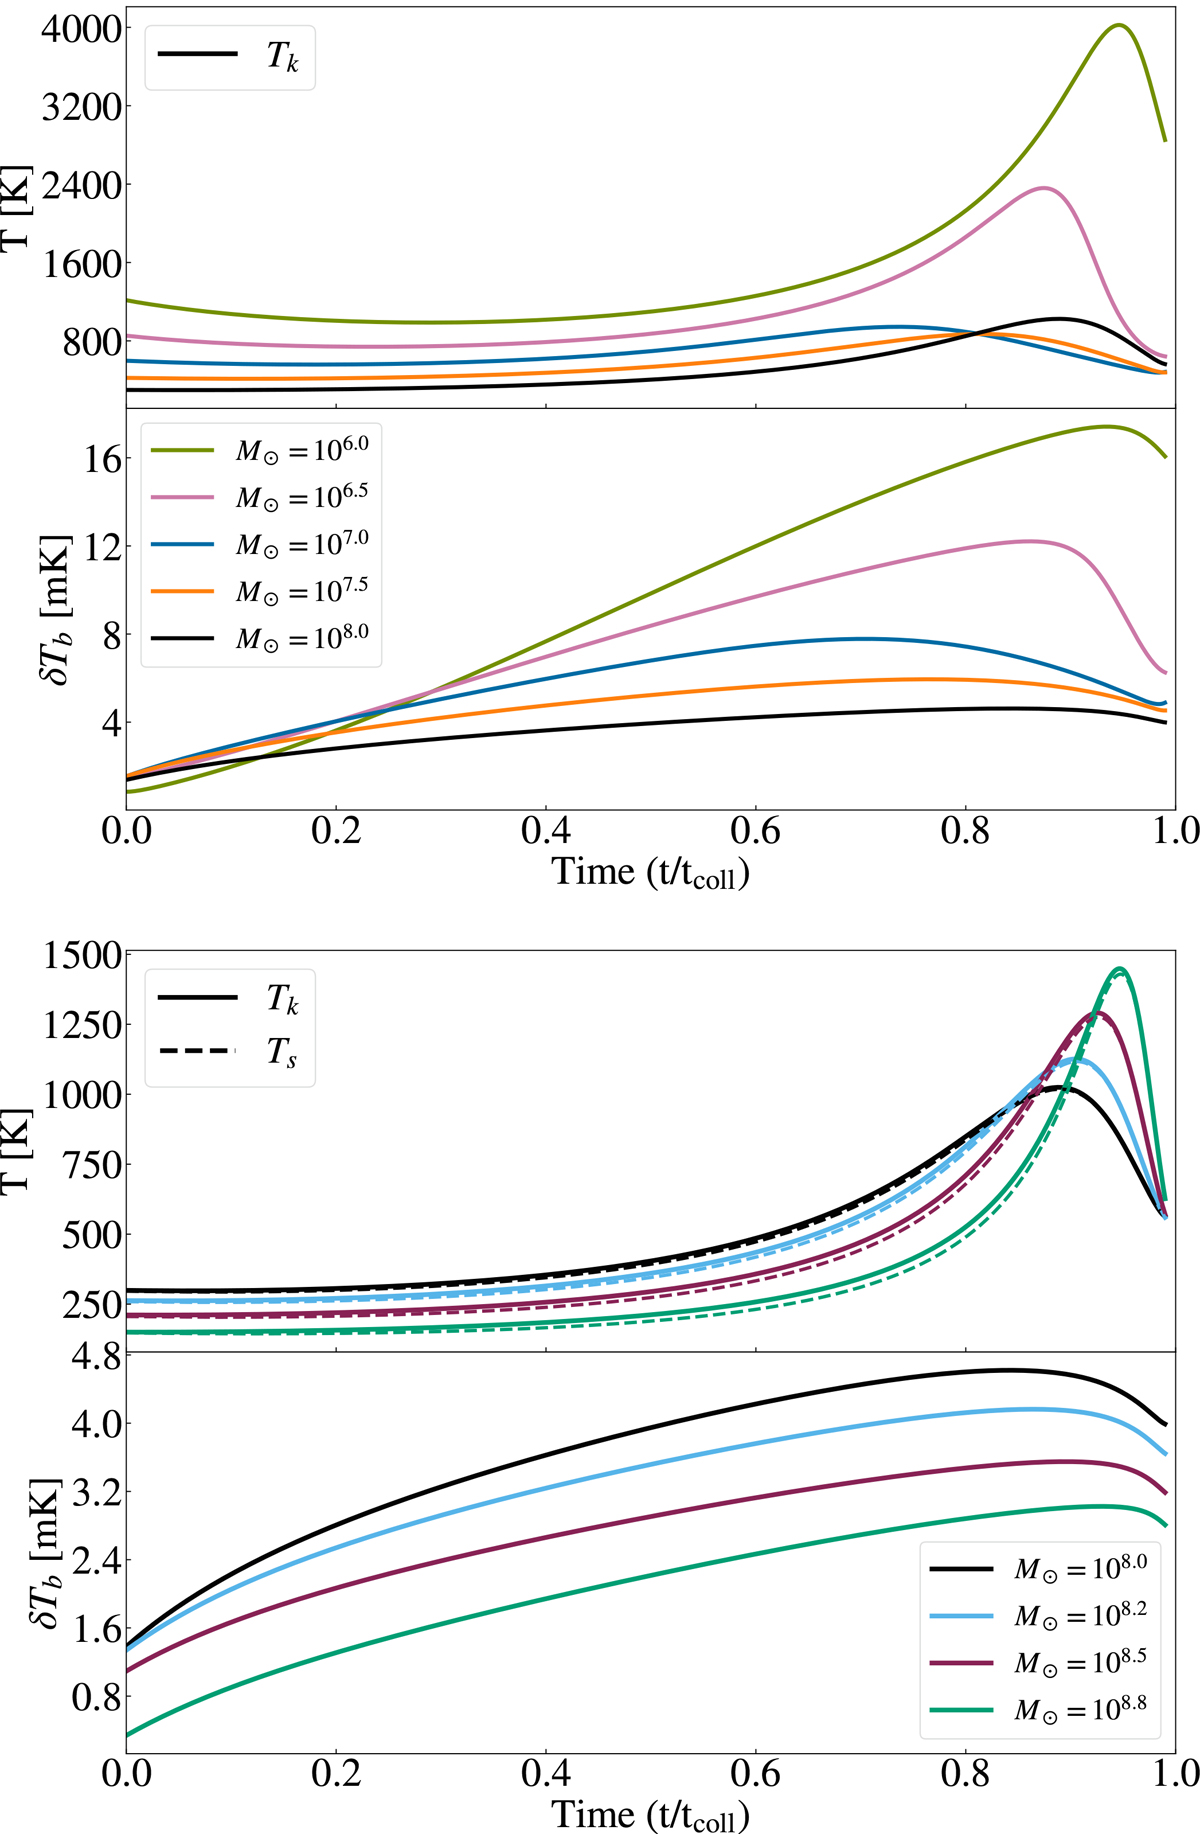
Top: Evolution of gas temperature, Tk (solid lines), for clouds of mass between 106.0 and 108.0 M⊙, as a function of the time to collapse (top). On the bottom of this plot are displayed the 21 cm differential brightness temperatures. Bottom: Same as the top panel, for masses between 108.0 and 108.8 M⊙, also displaying the 21 cm spin temperature Ts (dotted lines).
Current usage metrics show cumulative count of Article Views (full-text article views including HTML views, PDF and ePub downloads, according to the available data) and Abstracts Views on Vision4Press platform.
Data correspond to usage on the plateform after 2015. The current usage metrics is available 48-96 hours after online publication and is updated daily on week days.
Initial download of the metrics may take a while.