Fig. 7.
Download original image
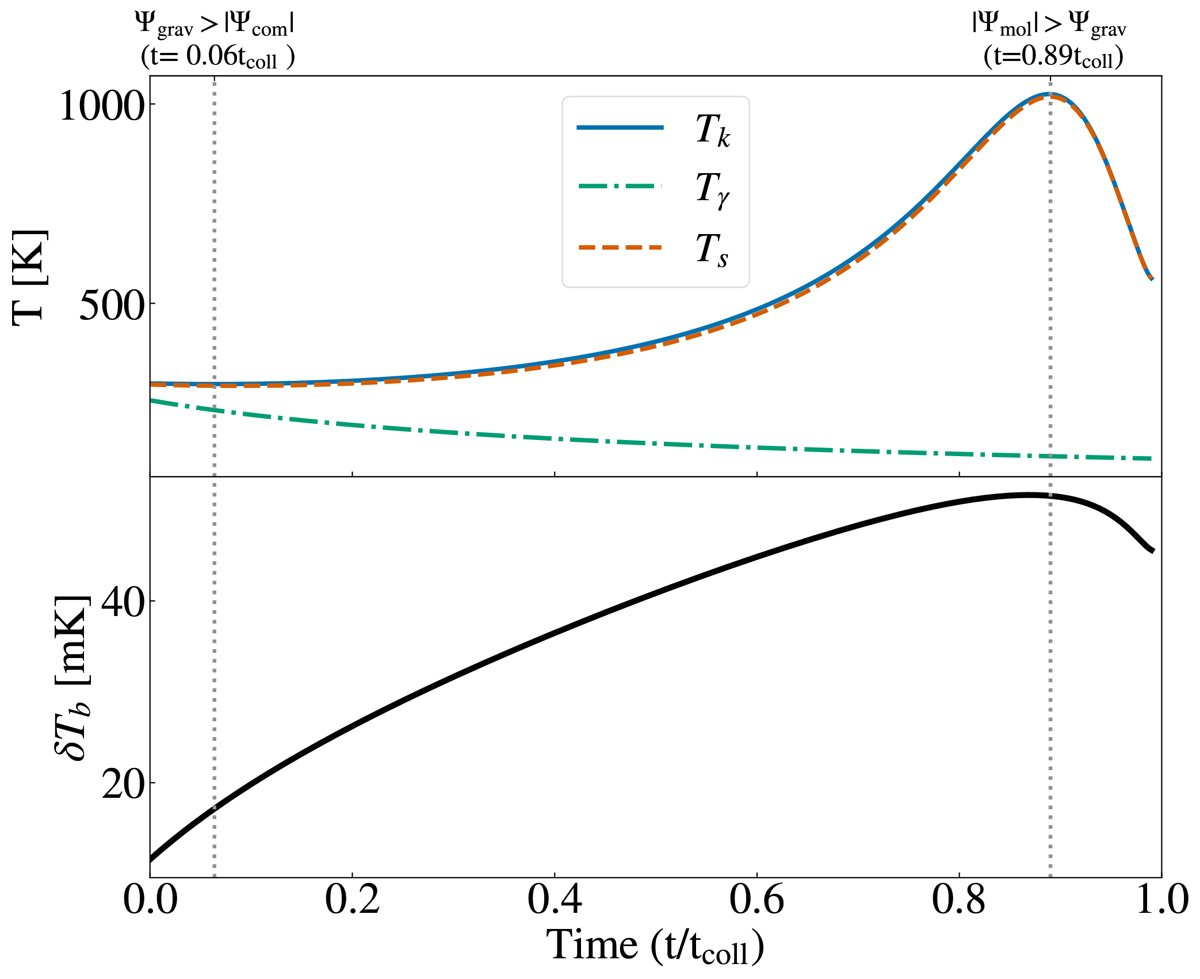
Top: Evolution of radiation temperature, Tγ (dash-dotted line), gas temperature, Tk (solid line) and 21 cm spin temperature, Ts (dotted line) for a collapsing 108 M⊙ cloud, as a function of the time to collapse. We highlight on top of the figure the times when the dominant thermal channel changes. Bottom: Evolution of the associated 21 cm brightness temperature from a collapsing 108 M⊙ cloud.
Current usage metrics show cumulative count of Article Views (full-text article views including HTML views, PDF and ePub downloads, according to the available data) and Abstracts Views on Vision4Press platform.
Data correspond to usage on the plateform after 2015. The current usage metrics is available 48-96 hours after online publication and is updated daily on week days.
Initial download of the metrics may take a while.