Fig. 9
Download original image
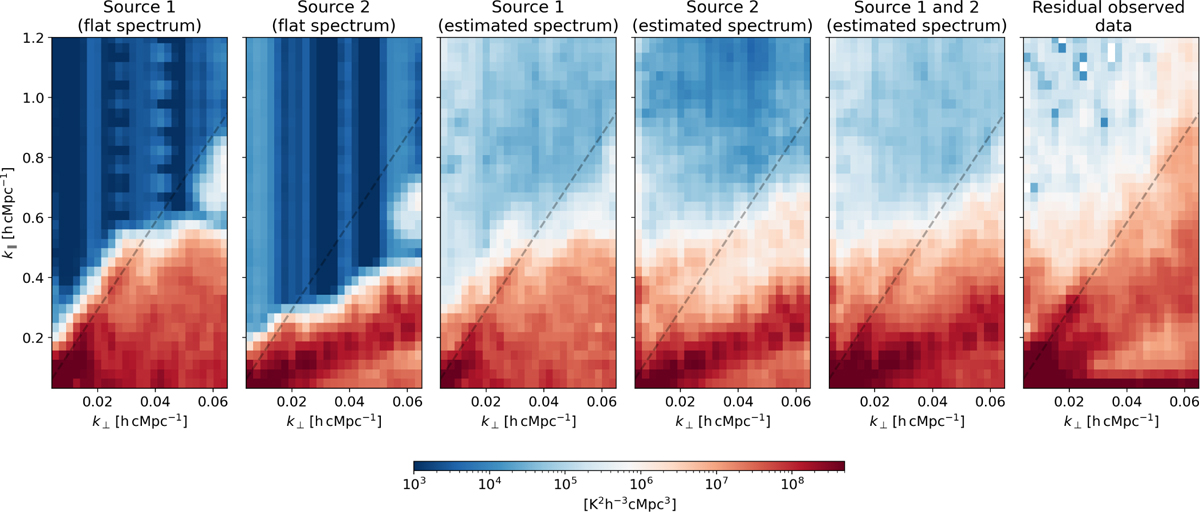
Impact of local RFI sources on the cylindrical power spectrum constructed toward the NCP field. The power spectra corresponding to a flat input spectrum are shown in the first two panels from the left. The next two panels show the power spectra corresponding to the estimated RFI spectra. The fifth panel from the left shows the total power from the two simulated RFI sources, and the right-most panel shows the residual data power spectrum after sky model subtraction. The black dashed lines indicate the horizon limit. We note that the noise power spectrum estimated from time-differenced Stokes V data is subtracted from the residual data power spectrum to enable a one-to-one comparison.
Current usage metrics show cumulative count of Article Views (full-text article views including HTML views, PDF and ePub downloads, according to the available data) and Abstracts Views on Vision4Press platform.
Data correspond to usage on the plateform after 2015. The current usage metrics is available 48-96 hours after online publication and is updated daily on week days.
Initial download of the metrics may take a while.