Open Access
Fig. 8
Download original image
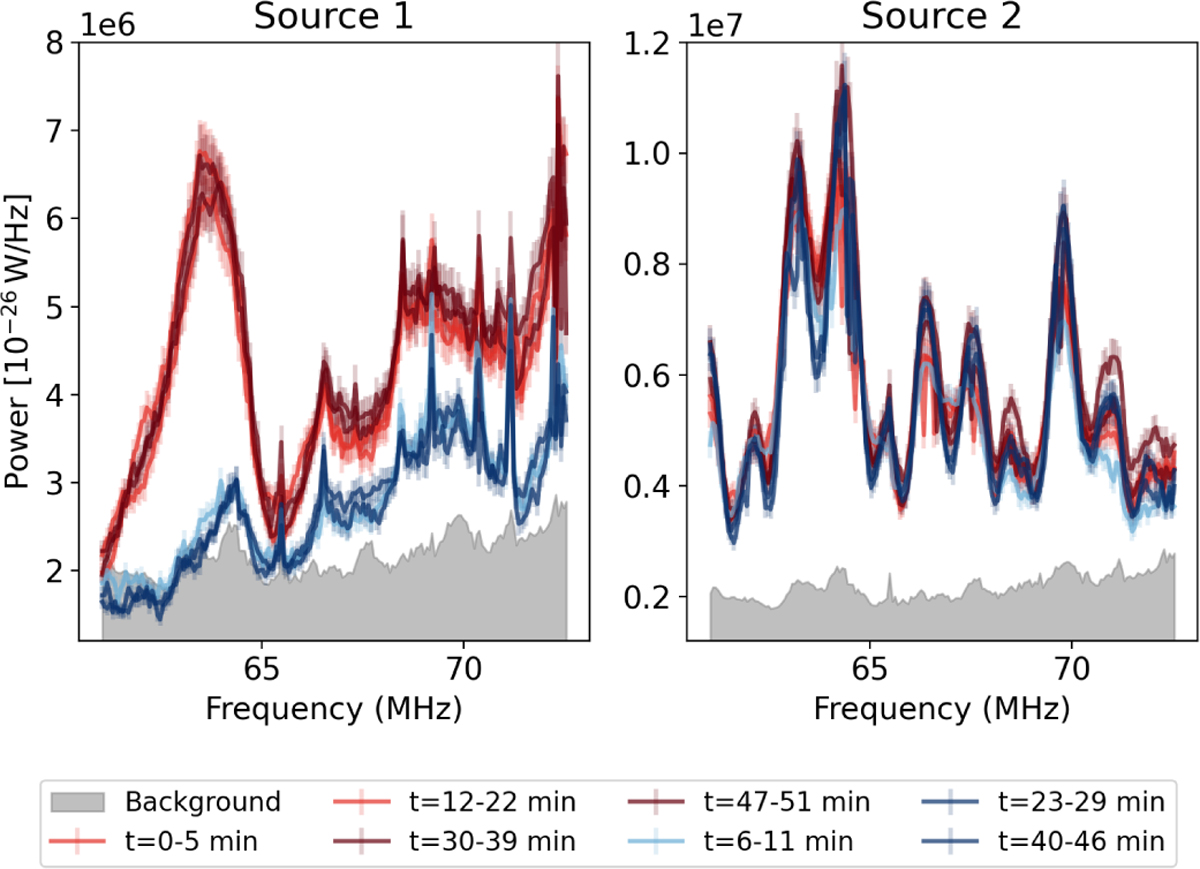
Spectra for the two sources estimated separately for different time segments. In both panels, the red lines show the spectra corresponding to the on times of source 1 and the blue lines show the spectra for the off times of source 1 identified from Fig. 7.
Current usage metrics show cumulative count of Article Views (full-text article views including HTML views, PDF and ePub downloads, according to the available data) and Abstracts Views on Vision4Press platform.
Data correspond to usage on the plateform after 2015. The current usage metrics is available 48-96 hours after online publication and is updated daily on week days.
Initial download of the metrics may take a while.