Fig. 6
Download original image
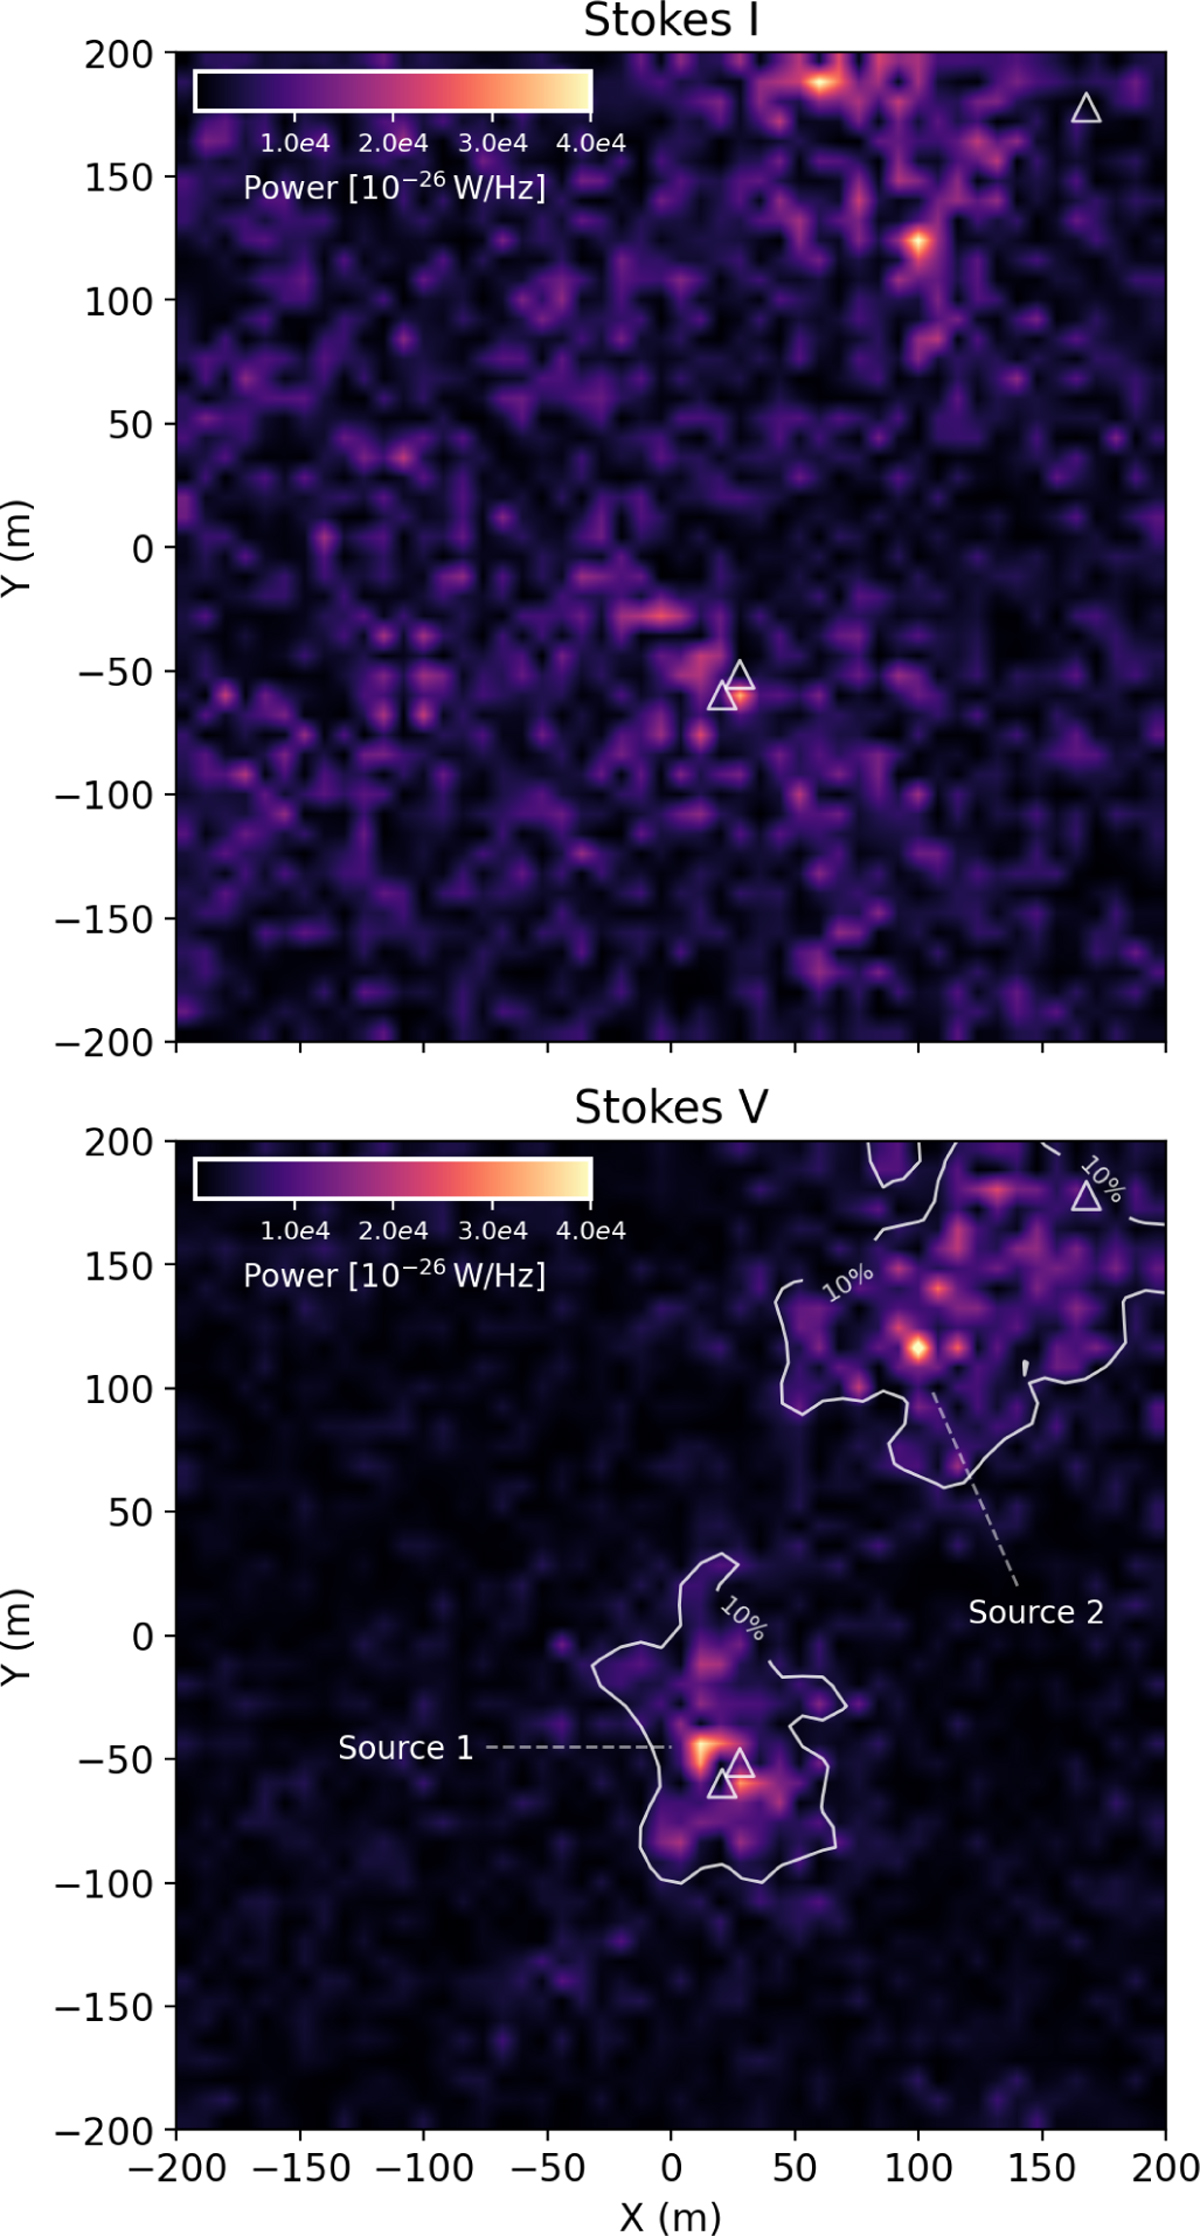
Near-field images of NenuFAR data made using the MAP method. The top and bottom panels correspond to frequency-averaged Stokes I and Stokes V images, respectively. The white curves in the Stokes V image are contours indicating 10 % of the peak power level. The white hollow triangles indicate the locations of the buildings in NenuFAR.
Current usage metrics show cumulative count of Article Views (full-text article views including HTML views, PDF and ePub downloads, according to the available data) and Abstracts Views on Vision4Press platform.
Data correspond to usage on the plateform after 2015. The current usage metrics is available 48-96 hours after online publication and is updated daily on week days.
Initial download of the metrics may take a while.