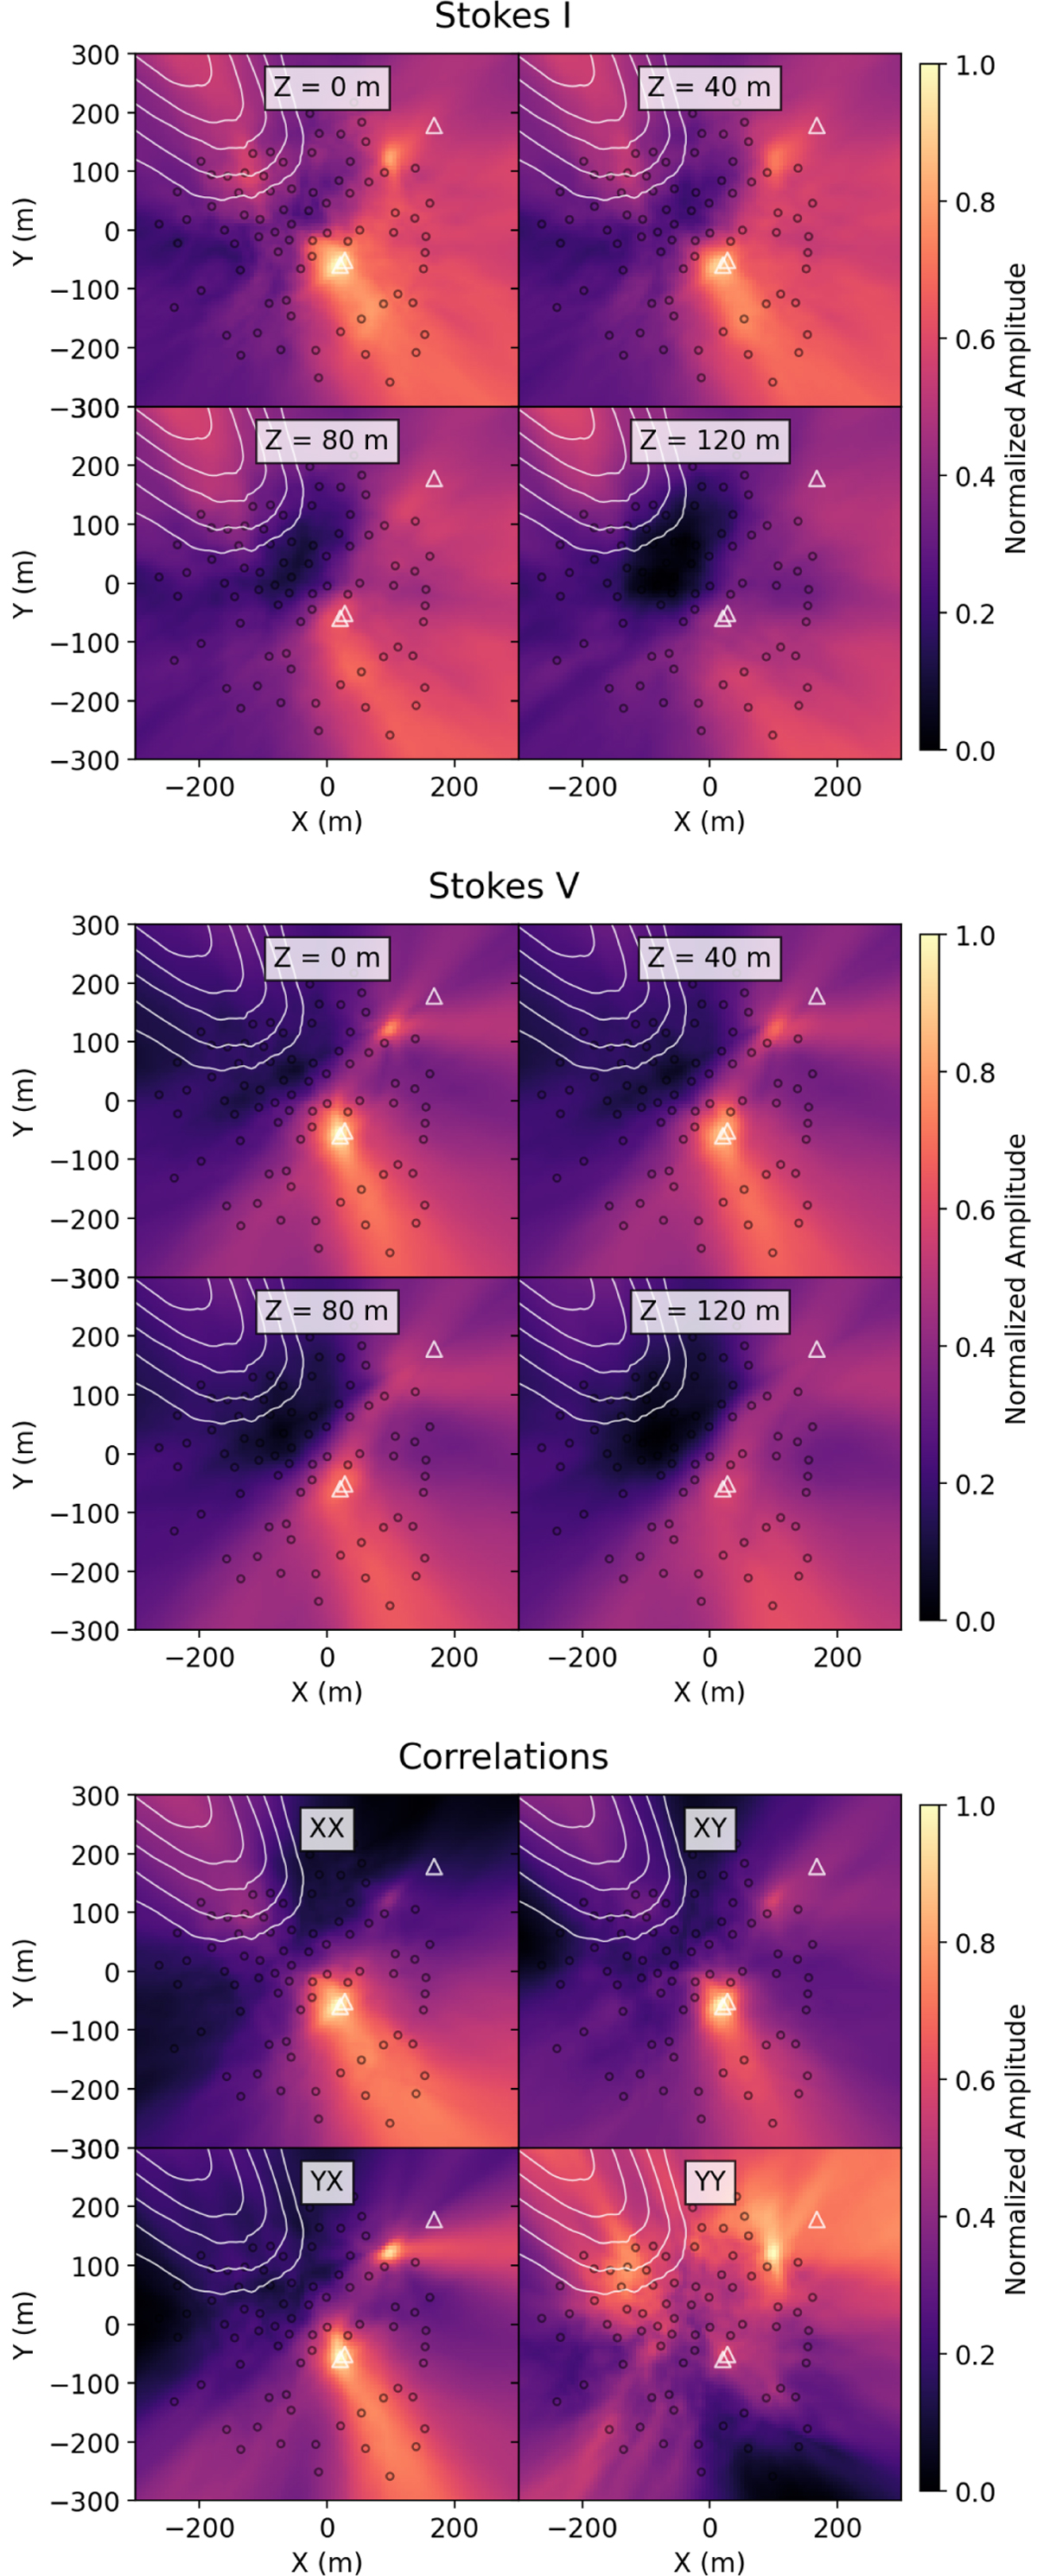
Fig. 5
Download original image
Matched filter images of NenuFAR data. Top panel: Stokes I images at different heights (Z). Middle panel: Stokes V images. Bottom panel: images at Z = 0 for different elements of the coherence matrix. Black circles represent NenuFAR core station locations, and triangles indicate buildings within the NenuFAR core. White contours indicate the projection of Cas A flux on the near-field domain.
Current usage metrics show cumulative count of Article Views (full-text article views including HTML views, PDF and ePub downloads, according to the available data) and Abstracts Views on Vision4Press platform.
Data correspond to usage on the plateform after 2015. The current usage metrics is available 48-96 hours after online publication and is updated daily on week days.
Initial download of the metrics may take a while.