Fig. 4
Download original image
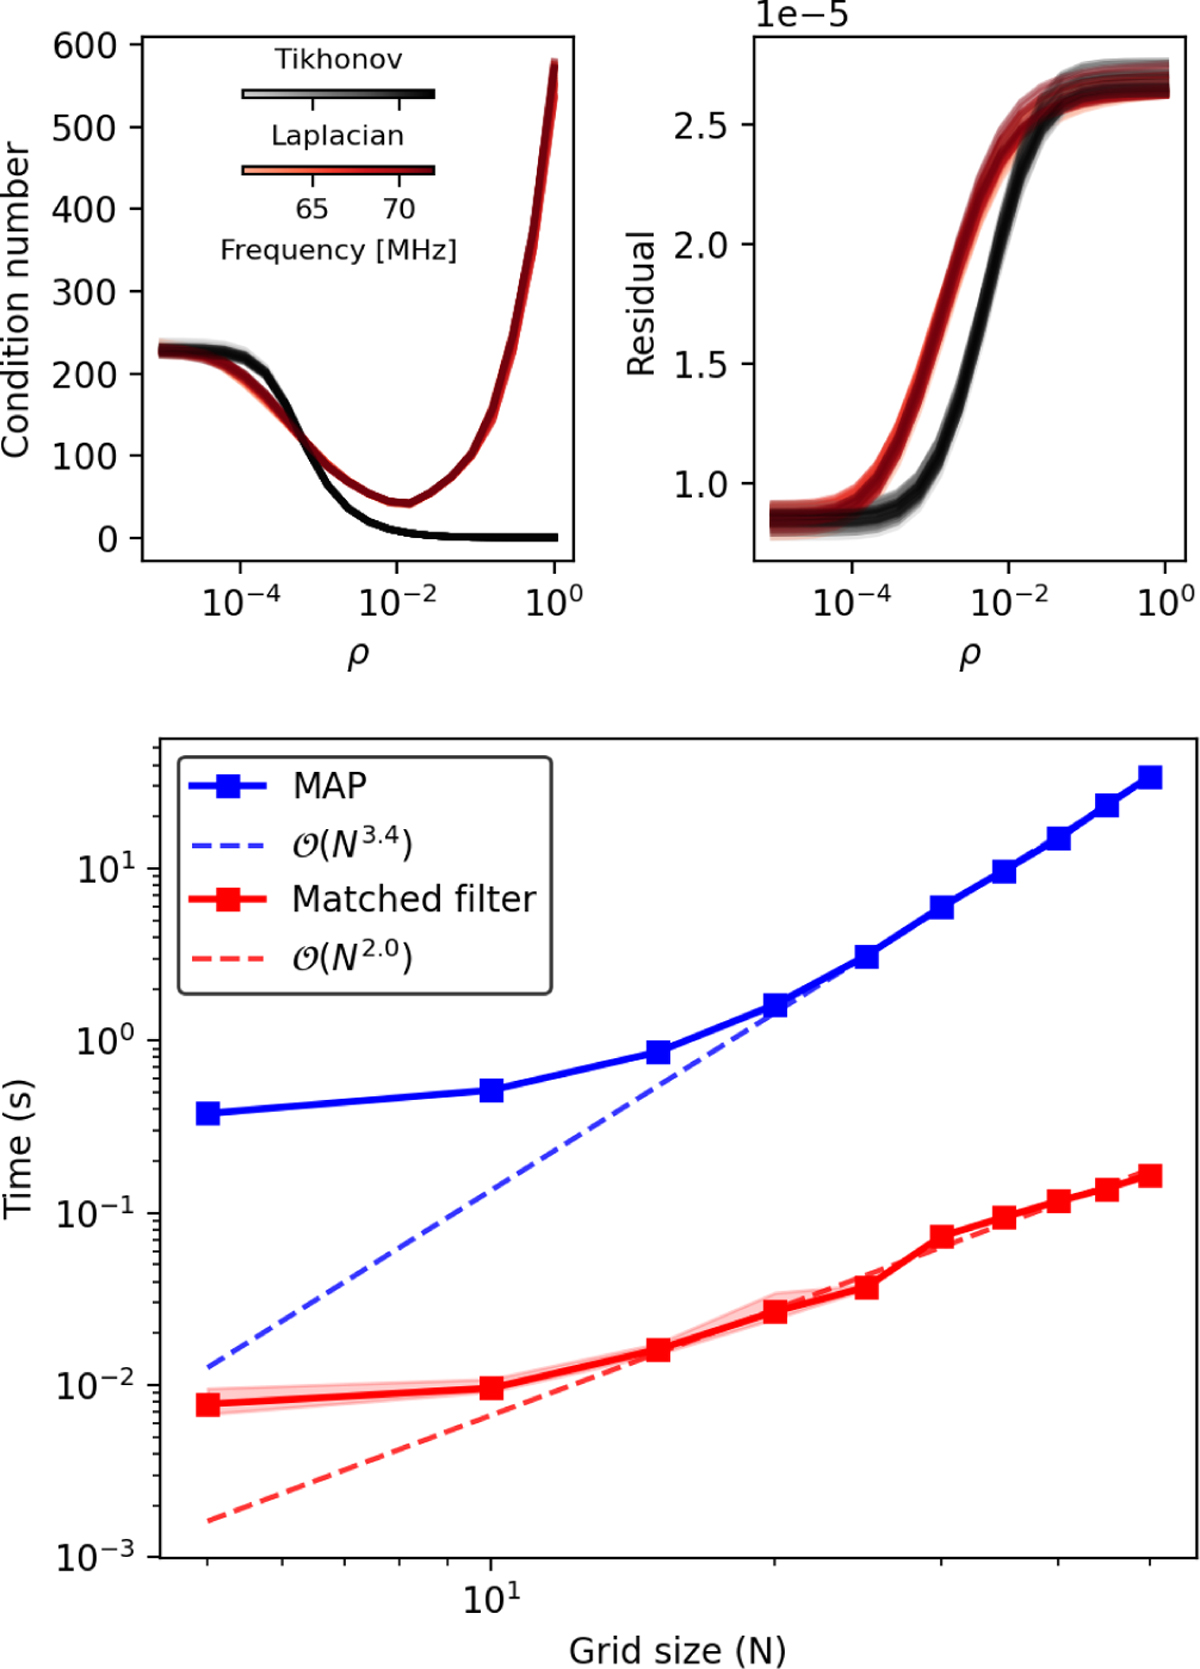
Stability and computational cost of the MAP and matched filter imaging algorithms. The top-left panel shows the condition number, and the top-right panel shows the least squares residuals from the MAP algorithm for both regularization schemes as a function of ρ and frequency. The bottom panel illustrates the computational cost of the MAP and matched filter imaging algorithms. The dashed lines indicate the least squares fit to the last six data points in log-log space.
Current usage metrics show cumulative count of Article Views (full-text article views including HTML views, PDF and ePub downloads, according to the available data) and Abstracts Views on Vision4Press platform.
Data correspond to usage on the plateform after 2015. The current usage metrics is available 48-96 hours after online publication and is updated daily on week days.
Initial download of the metrics may take a while.