Fig. 3
Download original image
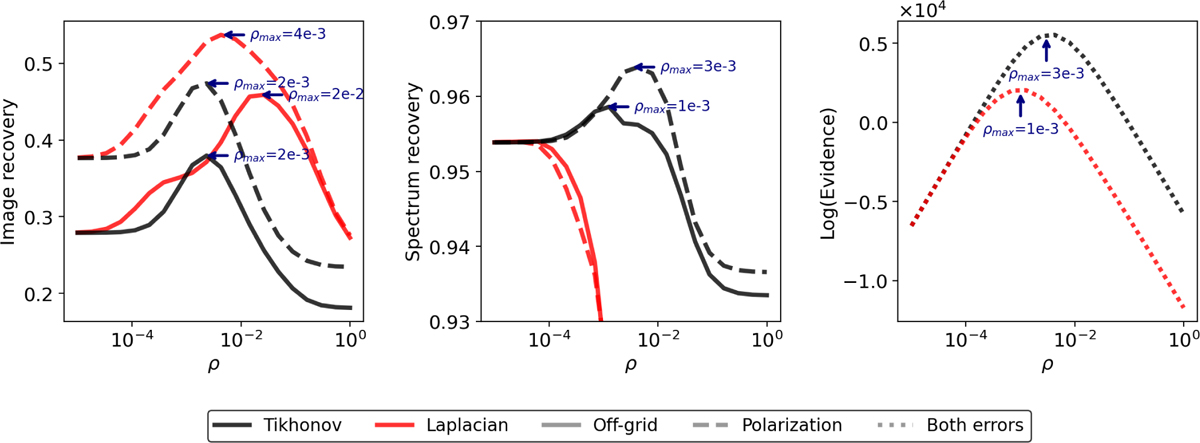
Optimal regularization parameters for image and spectrum recovery in MAP near-field imaging. The image recovery metric (left panel), the spectrum recovery metric (middle panel), and the log evidence (right panel) are shown as a function of ρ for Tikhonov and Laplacian regularization for both off-grid and polarization-induced errors. The ρmax corresponding to the peak values are indicated with blue arrows, except for the spectrum recovery metric for Laplacian regularization where a clear peak is not present.
Current usage metrics show cumulative count of Article Views (full-text article views including HTML views, PDF and ePub downloads, according to the available data) and Abstracts Views on Vision4Press platform.
Data correspond to usage on the plateform after 2015. The current usage metrics is available 48-96 hours after online publication and is updated daily on week days.
Initial download of the metrics may take a while.