Fig. 2
Download original image
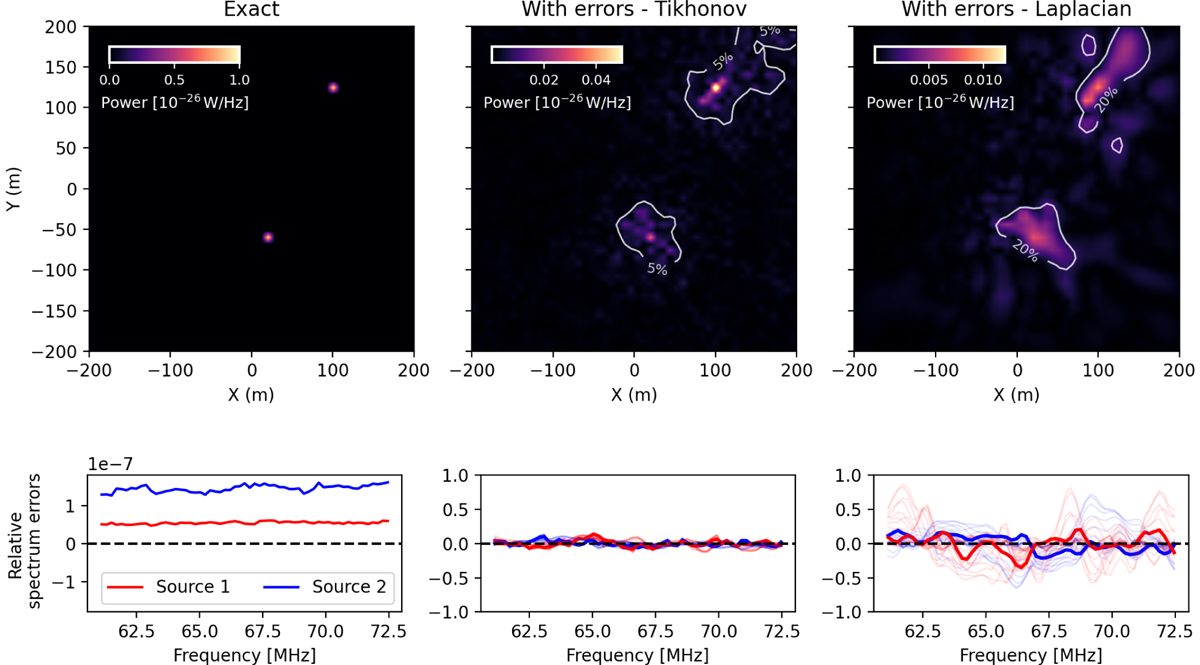
Images and spectra obtained from the MAP near-field imaging on simulated data. The leftmost column shows the exact case where the instrumental polarization is accounted for in the inversion. The next two columns show the inexact case corresponding to simulated data containing both off-grid and polarization-induced errors for Tikhonov and Laplacian regularization at ρ = 1.3 × 10⁻³ and 4.3 × 10⁻³, respectively. The top panels show the frequency-averaged images, and the bottom panels show the relative errors in the spectrum recovery for the three cases. The spectrum errors for the non-optimal ρ values are shown in faded colors.
Current usage metrics show cumulative count of Article Views (full-text article views including HTML views, PDF and ePub downloads, according to the available data) and Abstracts Views on Vision4Press platform.
Data correspond to usage on the plateform after 2015. The current usage metrics is available 48-96 hours after online publication and is updated daily on week days.
Initial download of the metrics may take a while.