Open Access
Fig. B.1
Download original image
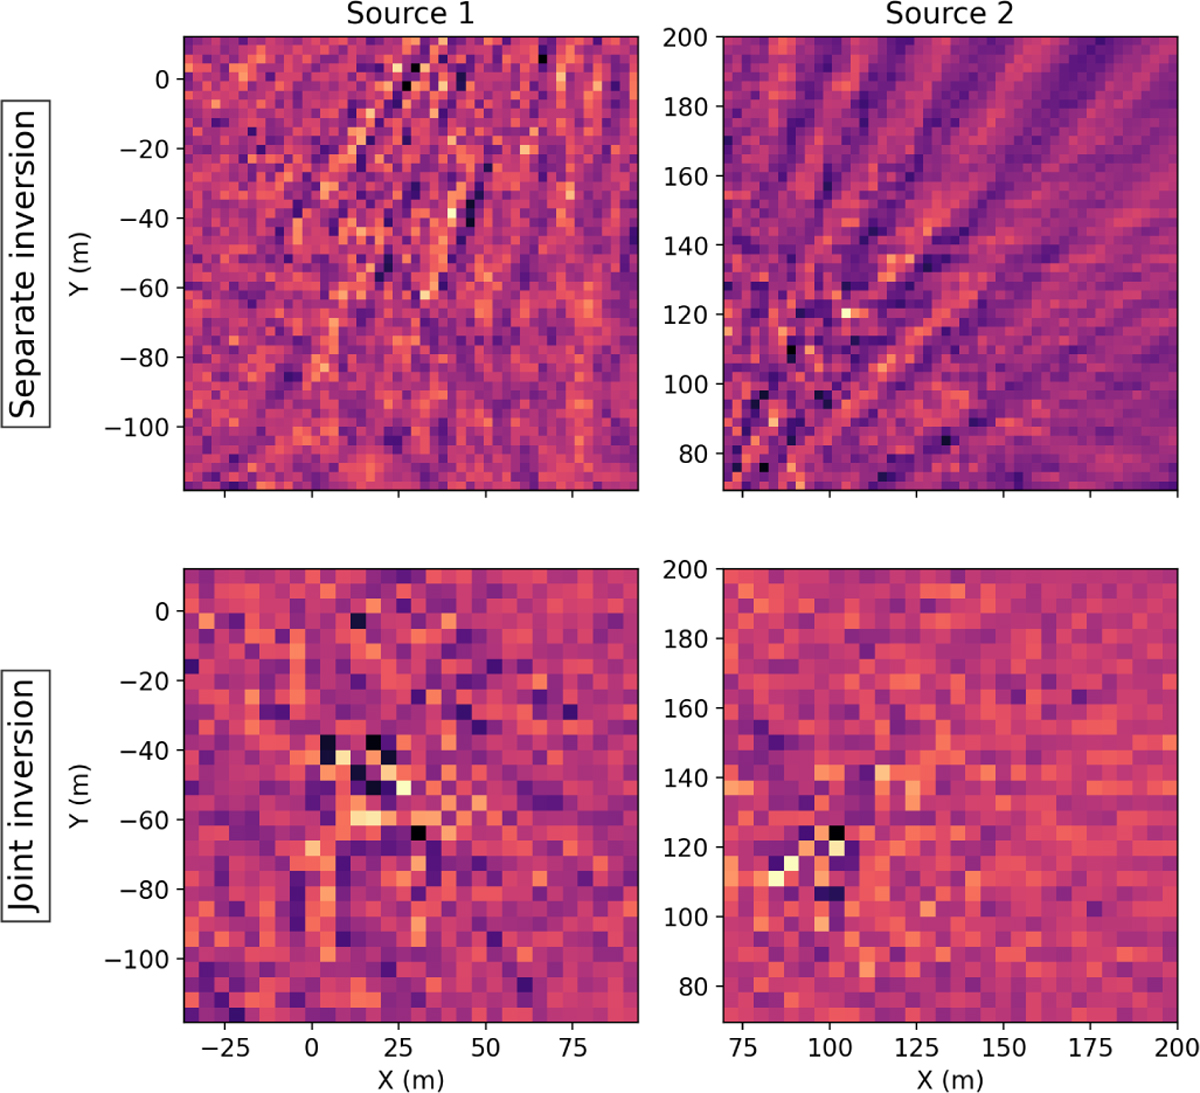
Near-field images made using the MAP method for small regions around the identified RFI sources. The top row corresponds to the images made separately for two grids. The bottom row shows the results of the joint inversion of two grids around the RFI source locations.
Current usage metrics show cumulative count of Article Views (full-text article views including HTML views, PDF and ePub downloads, according to the available data) and Abstracts Views on Vision4Press platform.
Data correspond to usage on the plateform after 2015. The current usage metrics is available 48-96 hours after online publication and is updated daily on week days.
Initial download of the metrics may take a while.