Fig. A.1
Download original image
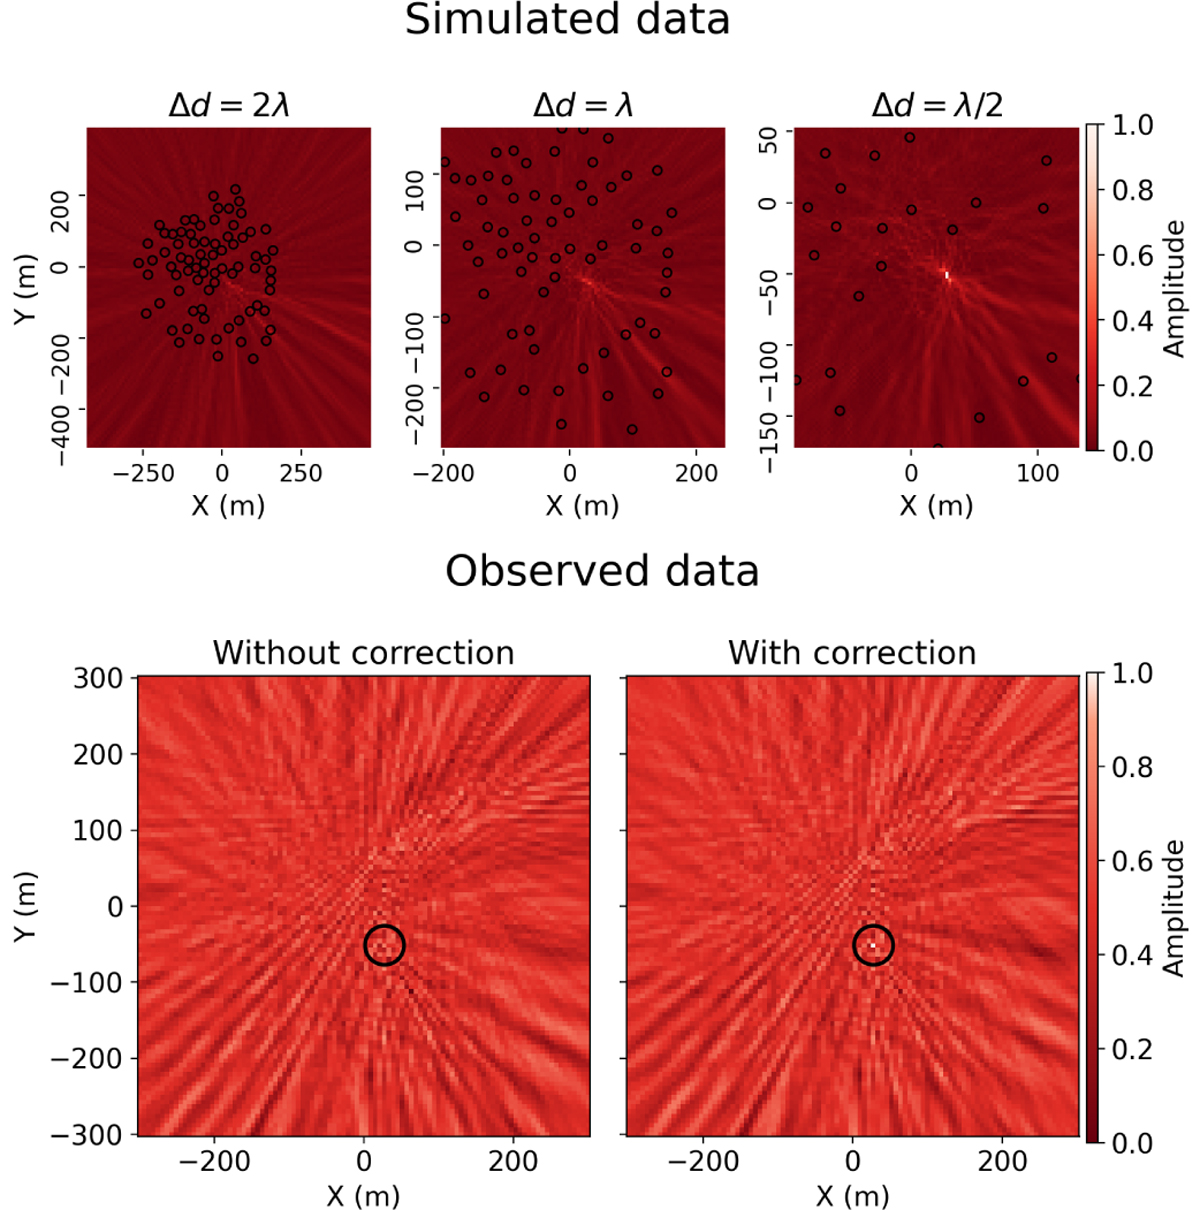
Matched filter near-field images with only baseline averaging. The three images in the top row (left to right) were constructed using progressively finer grid resolutions (Δd) from simulated data containing one local RFI source. Black circles indicate the NenuFAR station locations, providing a scale reference for the images. In the bottom row, the left panel shows the image made from Stokes V observed data, and the right panel shows the image constructed after the signs of the baselinedependent gains for source 1 have been estimated and corrected for. The location of the source is indicated with a black circle.
Current usage metrics show cumulative count of Article Views (full-text article views including HTML views, PDF and ePub downloads, according to the available data) and Abstracts Views on Vision4Press platform.
Data correspond to usage on the plateform after 2015. The current usage metrics is available 48-96 hours after online publication and is updated daily on week days.
Initial download of the metrics may take a while.