Fig. 12
Download original image
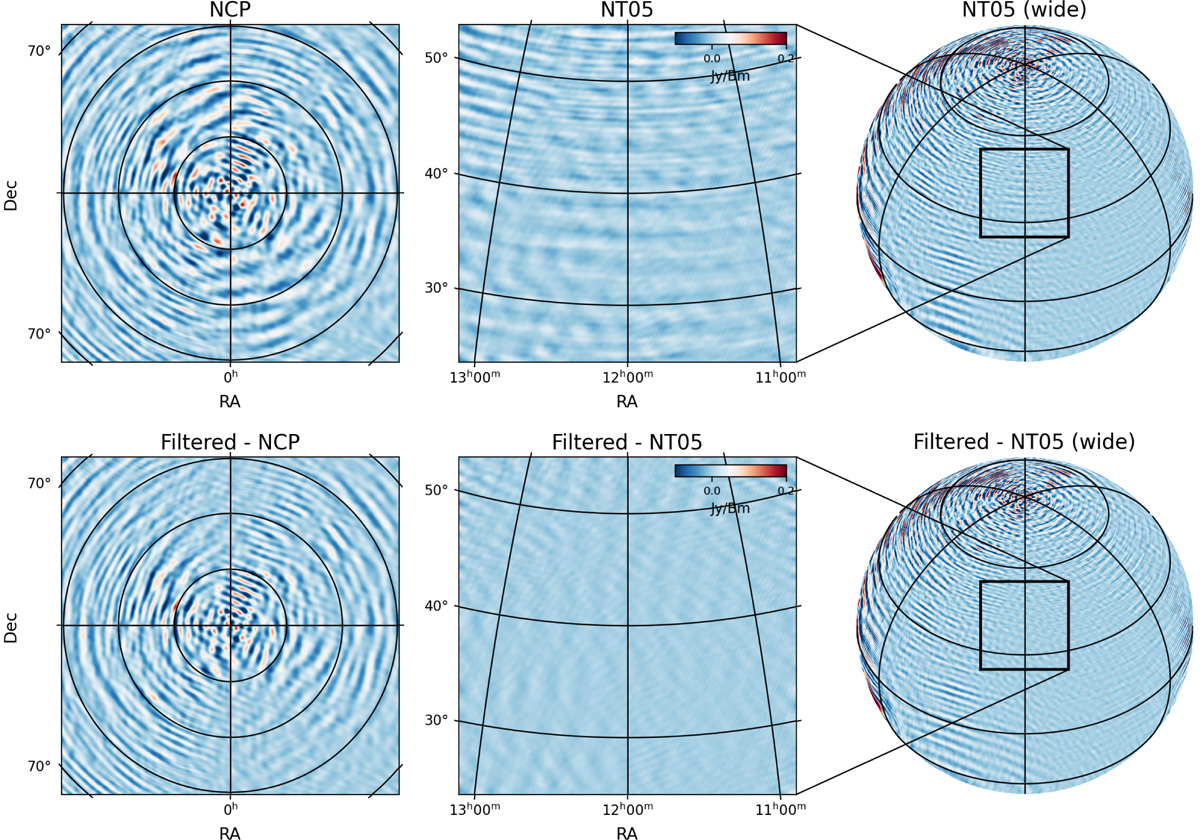
Impact of local RFI sources on far-field dirty images. The top row shows dirty images constructed from the simulated RFI visibilities, and the bottom row shows the images after the region |u| ≤ 10 is filtered out. The left and middle columns correspond to the NCP and NT05 fields, respectively. The rightmost column shows wide-field, full-sky images with the NT05 field indicated with a black square.
Current usage metrics show cumulative count of Article Views (full-text article views including HTML views, PDF and ePub downloads, according to the available data) and Abstracts Views on Vision4Press platform.
Data correspond to usage on the plateform after 2015. The current usage metrics is available 48-96 hours after online publication and is updated daily on week days.
Initial download of the metrics may take a while.