Fig. 11
Download original image
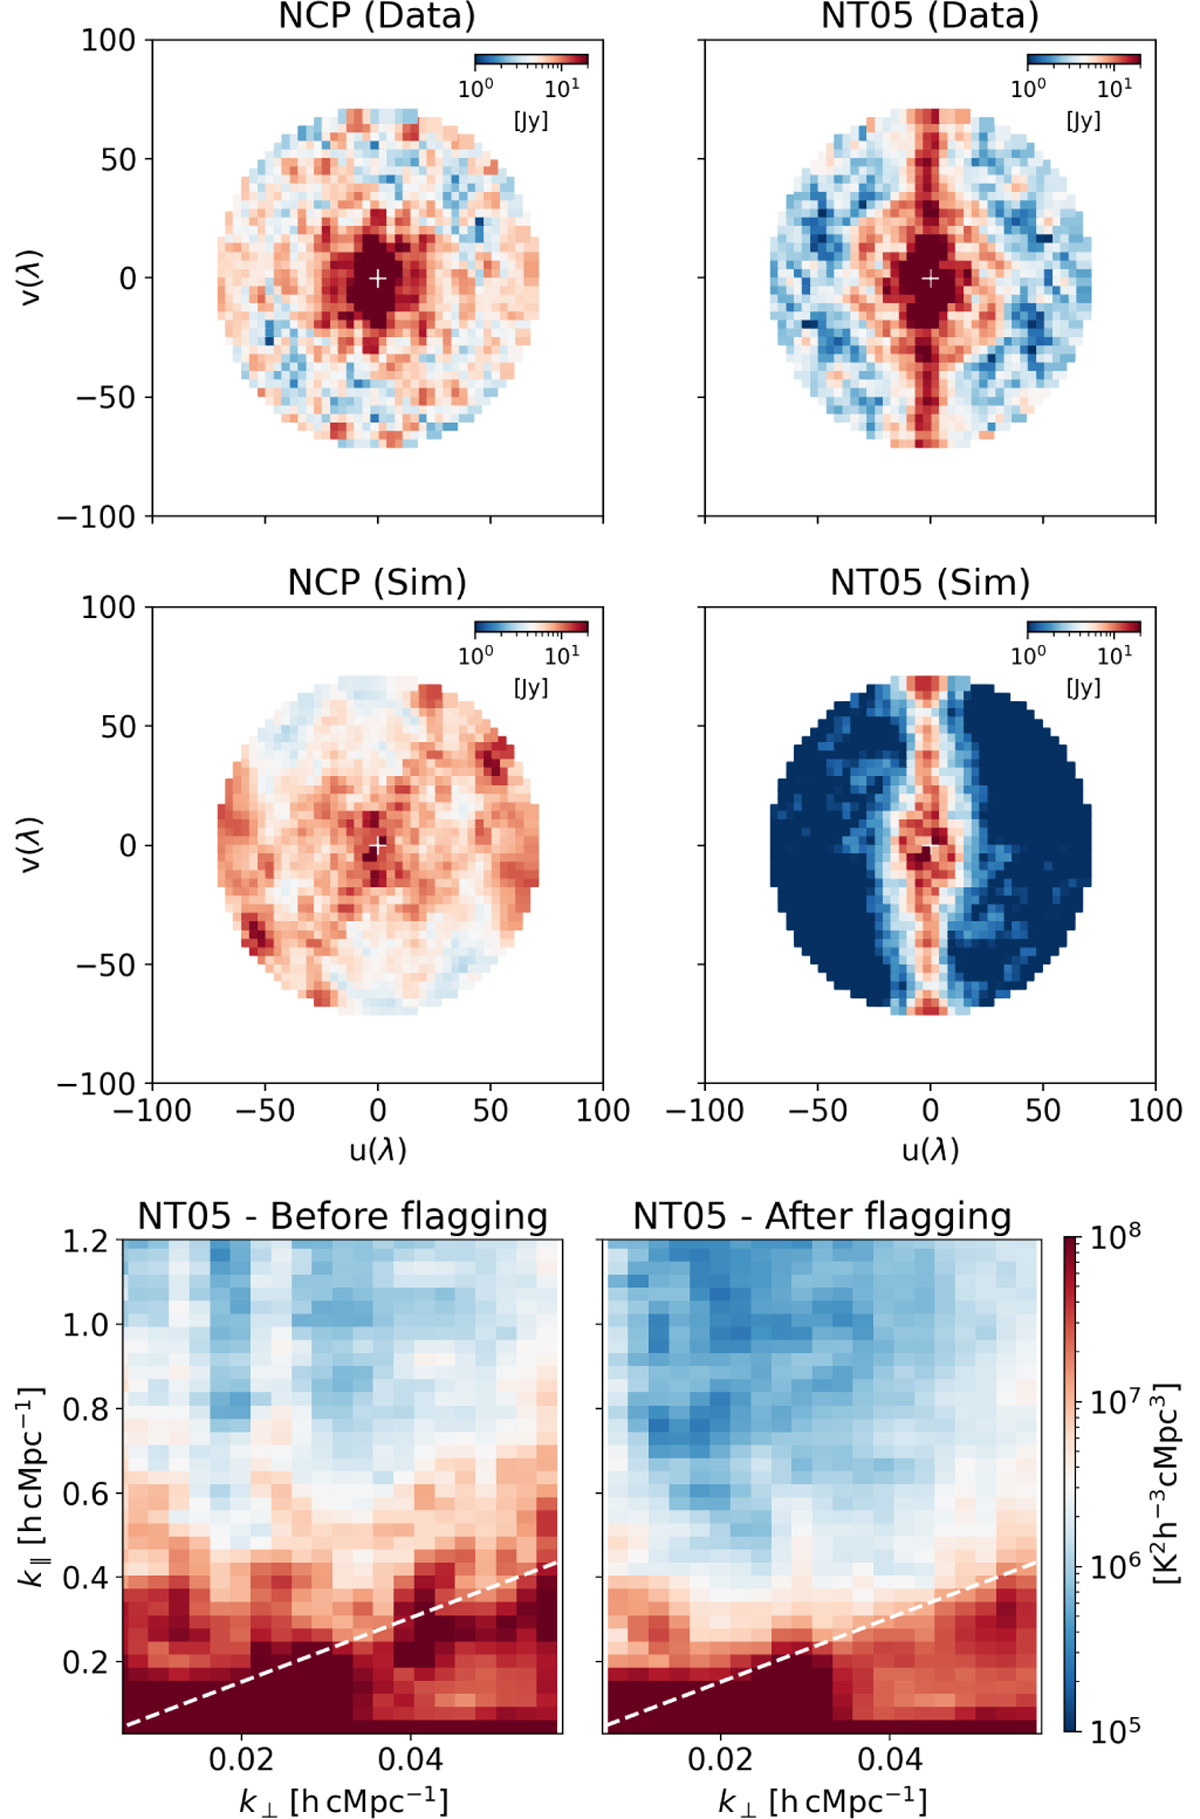
Impact of RFI sources on the u v plane and power spectra of different target fields. The visibility amplitude in the gridded u v plane for observed and simulated data for NCP and NT05 phase centers are shown in the top and middle rows. The bottom row shows the power spectra estimated from observed NT05 data, without (left) and with (right) the u v cells around the u = 0 line flagged. The white dashed lines indicate the horizon limit.
Current usage metrics show cumulative count of Article Views (full-text article views including HTML views, PDF and ePub downloads, according to the available data) and Abstracts Views on Vision4Press platform.
Data correspond to usage on the plateform after 2015. The current usage metrics is available 48-96 hours after online publication and is updated daily on week days.
Initial download of the metrics may take a while.